


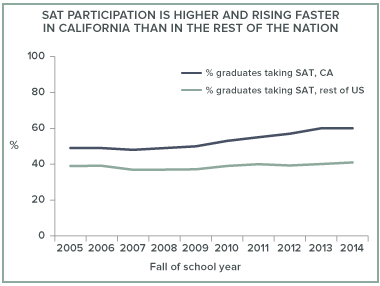
An increasing share of California students are taking the SAT. This is good news for California, suggesting that more and more students are preparing for college. Sixty percent of the high school graduating class of 2015 took the SAT, a much higher share than in the rest of the United States (41%). Moreover, SAT participation has been growing faster in California than in the rest of the nation.
 Even though raw scores have declined, once we adjust for the increased share of graduates taking the SAT, the latest scores represent an improvement from a decade ago. On average, California’s graduating class of 2015 scored 1,492 out of 2,400 points on the SAT college admission tests—28 points lower than a decade ago, and 2 points higher than the national average. However, once we factor in the increase in participation over the past decade, California’s 2015 score actually represents an improvement compared to a decade earlier. As participation in the SAT increases, the mix of students taking the exam shifts towards those less academically prepared. In states with high average SAT scores, participation rates are very low, because the only students who participate tend to be very well prepared. On average, a 1 percentage point increase in participation is associated with a 3.4 point decrease in average performance. Given the 11 percentage point increase in participation among California high school seniors over the past decade, we would expect the state’s average SAT score to drop 10 points more than it did.
 Latino students have experienced the largest increase in SAT participation. Over time, SAT participation has increased steadily among all major racial/ethnic groups—including Asian, white, Latino, and African American students. But the largest gain has been among Latino students. For instance, in the 2013–14 school year, 43 percent of Latino graduates took the SAT, up from 35 percent in 2005–06. (Graduation data for 2014–15 has not yet been released.)
Race/ethnicity-related performance gaps are changing. Asian students outperformed white students in the 2014–15 school year by 11 points, reversing a trend in which whites were the higher scorers. The gap between African Americans and whites has narrowed over time. In the 2014–15 school year, white students scored 295 points higher, on average, than African American students and the score gap has decreased from 317 points in the 2005–06 school year. However, the Latino-white gap has increased slightly—not very surprising given the huge increase in Latino students’ participation in the SAT.
 Parental education level, family income matters more now. Parental education and family income are closely related to SAT performance. In 2014–15, students whose parents have bachelor’s degrees scored, on average, 1,601 points—200 points higher than students whose parents have only a high school diploma. Over time this gap has widened, mostly because students whose parents have graduate degrees are scoring higher on the SAT. There is also a widening performance gap connected to gaps in family income, particularly at the upper end of income distribution. For instance, the performance gap between students whose families make more than $200,000 (roughly the top 10 percentile) and those from families earning $60,000 to $80,000 (roughly the median household income) widened from 172 points in 2007 to 251 points in 2014.
The increase in SAT participation, especially among groups that are underrepresented in higher education, is good news for California. At the same time, the continuing gaps in performance represent an ongoing challenge that must be addressed, especially given California’s changing demographics.