

Summary
The Local Control Funding Formula (LCFF) reformed California’s K-12 school finance system. It replaced a patchwork of formulas and specific (or “categorical”) programs with a focus on local control, funding equity, and additional support for the large share of students (63%) who are “high needs”—that is, low-income, English Learner, and/or foster care youth. However, there are still concerns about whether the new funding will reach high-need students. Because districts have spending flexibility, and because some of the extra funding for high-need students is based on their districtwide enrollment levels, it is possible that high-need schools in districts with relatively low overall shares of high-need students will not get the funding they need. Our research indicates that county offices of education-which are charged with assisting districts in developing and achieving accountability plans-may have extra work to do in parts of Southern California, the Bay Area, and Sacramento to ensure that extra state funding improves outcomes of high-need students who are not evenly distributed across district schools.
Introduction
By increasing funding transparency and equity, the Local Control Funding Formula makes it easier to understand the goals of the state’s public education system. LCFF gives districts control over how to spend state funding while requiring them to “increase or improve services” for high-need students in proportion tothe increased funding these students generate.
However, LCFF has not eliminated all concerns about funding adequacy and about how districts with unevenly distributed high-need students will allocate funds to students. Districts in which high-need students are concentrated in only a few schools may need to develop spending plans that explicitly dedicate funding to schools that are educating large shares of high-need students.
In this report, we investigate the potential for mismatches between spending and need by identifying districts in which high-need students are concentrated in just a few schools. We start with an overview of LCFF. We then examine the distribution of high-need students across the state, across schools, within school districts, and the special case of concentration grant funding to districts where more than 55 percent of students are high need.
How Are LCFF Funds Distributed?
The LCFF distributes funding from the state to districts primarily through three grants: the base grant, the supplemental grant, and the concentration grant.1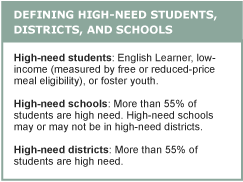 The base grant varies by grade level and is keyed to the average daily attendance (ADA) of students in four grade spans: K-3, 4-6, 7-8, and 9-12. K-3 and 9-12 receive additional funding to support smaller class sizes and career technical education (CTE).2
The other two grants are focused on districts with high-need students; these districts tend to have lower Academic Performance Indexes.3 LCFF addresses that inequity with extra funding for English Learner (EL), low-income, or foster care students. District policies for identifying English Learners and enrolling students in free or reduced-price lunch can vary. (A related PPIC report examines enrollment in free or reduced-price meal programs across California.)4 Funding is determined by unduplicated counts-to avoid “double counting” a single student who is both an EL and in foster care, for example. School districts and charters receive supplemental funding equal to 20 percent of the base grant for each high-need student.
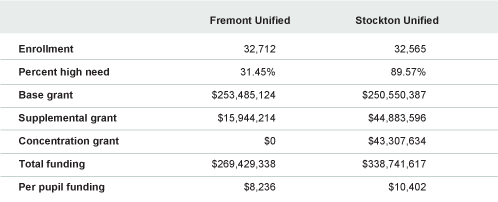
Concentration grants go to districts in which more than 55 percent of students are high need.5 For each student above the 55 percent threshold, districts receive funding equal to 50 percent of the base grant. This three-grant system can create large differences in per pupil funding. For example, Fremont and Stockton Unified School Districts are similar in size, but Stockton has a much larger share of high-need students. As a result, Stockton receives nearly $70 million more in funding (Table 1).
Table 1. LCFF Grants Can Vary Greatly Among Districts of Similar Size
LCFF allows funds to be spent for any educational purpose but requires districts to develop Local Control and Accountability Plans (LCAPs) that detail district goals and document how districts plan to measure their progress toward those goals. School districts must improve or increase services for high-need students in proportion to the increased funding they receive,6 but they may spend supplemental and concentration grants on district- and school-wide programs.7 This is the first year of LCAP development, and it is not yet clear if district plans are sufficient to improve outcomes for students-for high-need students in particular. A related PPIC report assesses LCAPs from a diverse set of districts and finds that their effectiveness varies.8
County offices of education are responsible for reviewing and approving district LCAPs. Part of the review process involves evaluating whether supplemental and concentration funding is “principally directed towards, and are effective in, meeting the district’s goals for its unduplicated pupils.”9 Early research suggests that many county offices are overwhelmed by these new responsibilities.10
How Are High-Need Students Distributed across the State?
The majority of the state’s K-12 students are considered high need (63%). More than half are low income (eligible for free or reduced-price meals), nearly a quarter (24%) are English Learners, and 0.5 percent are foster youth. For the purposes of calculating the LCFF grant, students who are in more than one of these categories only generate supplemental funding once for their district.11 All foster youth are eligible for free and reduced-price meals, as are approximately 75 percent of EL students.12 Thus, the unduplicated high-need counts are considerably lower than the sum of EL, low-income, and foster care students.
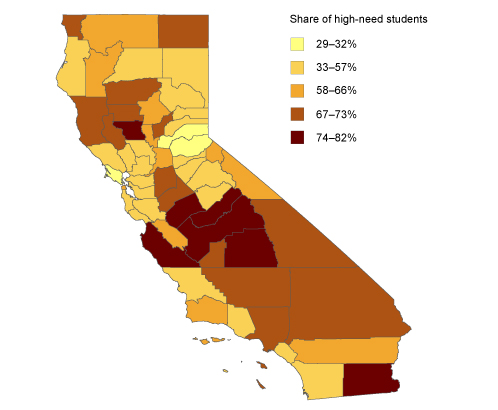
Not surprisingly, the concentration of high-need students across the state is not uniform (Figure 1). Seven of California’s 58 counties have K-12 student populations that are more than 73 percent high need-including many counties in the Central Valley (Merced, Madera, Fresno, and Tulare) and Imperial, Monterey, and Colusa Counties. In these counties, 129 of the 156 school districts have shares of high-need students above 55 percent. Altogether, there are 549 school districts in the state with student populations that are more than 55 percent high need. These districts receive both supplemental and concentration grants.
Figure 1. The Concentration of High-Need Students Varies Across Counties
How Are High-Need Students Distributed within Districts?
To the extent that the share of high-need students in individual schools matches the share in the district overall, the LCFF should be effective in distributing funding to needy students. But districts in which only a few schools have large shares of needy students might need to direct supplemental and concentration funding to those schools in order for the new LCFF funding to improve outcomes for high-need students. LCAPs require districts that use supplemental and concentration funding for district- and school-wide expenses to justify doing so.
We find that, on average, as the district share of high-need students increases, so too does the share of high-need students at district schools. However, if we examine districts in which 63 to 70 percent of students are high need (just above the state average), we see that there are many schools with much larger and smaller shares of high-need students. In districts with shares of high-need students that are somewhat larger than the state average, some schools have no high-need students and other schools have student bodies that are nearly 100 percent high need.13
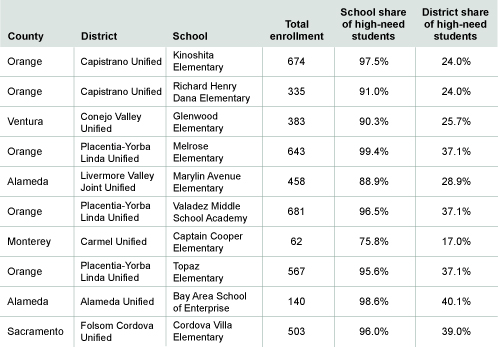
Of the 10 schools that have the largest difference between the share of high-need students at the school and at their district, most are in Southern California (Table 2). Most of these schools have high-need-student rates of above 90 percent, at least 57 percentage points higher than their district rates. Two elementary schools in Capistrano Unified are first and second, but Capistrano is not the only district represented more than once: Placentia-Yorba Linda Unified, also in Orange County, has three schools in the top ten.
These districts may well have robust and effective spending and programmatic plans for reaching their high-need students. A cursory review of their first LCAPs suggests that most districts shown in Table 2 do mention high-need students, and some even mention specific schools. However, most district plans for spending and curriculum do not contain enough detailed budgeting information to indicate whether districts are adding services or spending “proportionately” on high-need students.14 It will be years before we can assess the effectiveness of district spending by examining student outcomes.
Table 2. Several Schools in Orange County Have Dramatically Larger Shares of High-Need Students than Their Districts
SOURCE: Authors’ calculations from CALPADS Unduplicated Pupil Count Source File.
NOTE: Excludes county offices of education schools, non-school locations, State Board of Education, and Statewide Benefit Charters, as well as nonpublic/nonsectarian schools, juvenile court schools, youth authority facilities, and schools with fewer than 50 students. Most schools in this list are elementary schools. Overall, we find that elementary schools are only somewhat more likely differ from their districts in terms of share of high-need students than middle and high schools. This slight overrepresentation is probably attributable to the fact that elementary schools are more likely to draw from one neighborhood than schools serving older children, and many neighborhoods throughout the state remain segregated.
How Much Does High-Need Student Enrollment Vary within Districts?
We created a measure of the difference in the concentration of high-need students across the schools within each district.15 A district in which every school has the same share of high-need students would have a value of zero. Statewide, we find that the school-to-district average concentration difference is 12 percentage points and ranges from 0 to 30 percentage points.
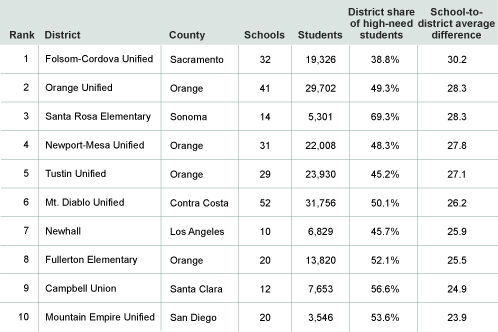
The six schools in Folsom Cordova Unified are about 30 percentage points different from the district average, suggesting that some are well above and some well below the district’s average share of high-need students (39%). Districts with large school-to-district average difference will need to direct funding to programs that reach those students, and may find district-wide use of concentration and supplemental funds less effective for improving outcomes for high-need students. Unlike the differences across schools, which are concentrated in Southern California, the districts with larger average school-to-district differences are slightly more geographically diverse (Table 3).
Table 3. The Largest School-To-District Differences in the Share of High-Need Students are in the Bay Area, Sacramento, and Southern California
SOURCE: Authors’ calculations from CALPADS Unduplicated Pupil Count Source File.
NOTES: Excludes county office of education schools, non-school locations, State Board of Education, and Statewide Benefit charters, as well as nonpublic/nonsectarian schools, juvenile court schools, youth authority facilities, and districts with fewer than 10 schools. Monterey County’s Big Sur Unified has the highest average absolute difference measure (56%) but it only has two schools and 73 students, so we do not list it here.
Among the 10 most populous districts, San Diego Unified has the highest school-to-district average difference in concentrations of high-need students (22 percentage points, 34th statewide). Los Angeles Unified serves more than 600,000 students in more than 900 schools, has an average school-to-district variation of 14 percentage points, which places it 140th statewide.16
Which Counties Need to Monitor Unevenly Distributed High-Need Students?
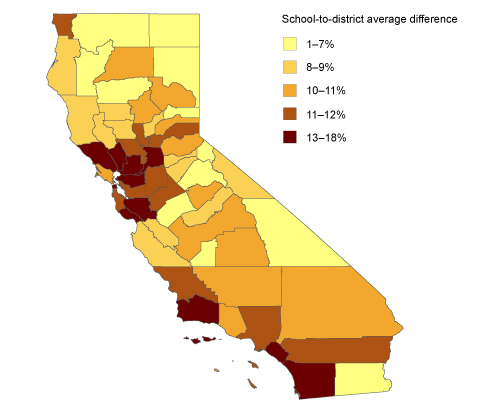
As we have seen, districts with large differences between individual schools’ and districts’ share of high-need students are not evenly distributed across the state. Which counties have the most districts with unevenly distributed high-need students? Bay Area counties: San Francisco,17 Sonoma, Napa, Solano, Contra Costa, Santa Clara, and Santa Cruz (Figure 2). The highest level of variation within a county ranges from 13 to 18 percentage points; the lowest ranges from 1 to 7 percentage points. Sacramento, Santa Barbara, Orange, and San Diego Counties are the other parts of the state where the concentration of high-need students in individual schools tends to vary from the district average.
Figure 2. Districts with the Most Unevenly Distributed High-Need Students are in Bay Area and Southern California Counties
SOURCE: Authors’ calculations from CALPADS Unduplicated Pupil Count Source File.
NOTE: Excludes county offices of education schools, non-school locations, State Board of Education, and Statewide Benefit charters, as well as nonpublic/nonsectarian schools, juvenile court schools, and youth authority facilities.
Recall that there is no overlap between the counties in the top fifth in Figure 2 and the counties with the largest percentage of high-need students overall (as shown in Figure 1). This indicates that counties with high numbers of high-need districts may not have to worry as much about monitoring the distribution of funding to high-need schools.
Not All Concentrations of High-Need Students Generate Concentration Funds
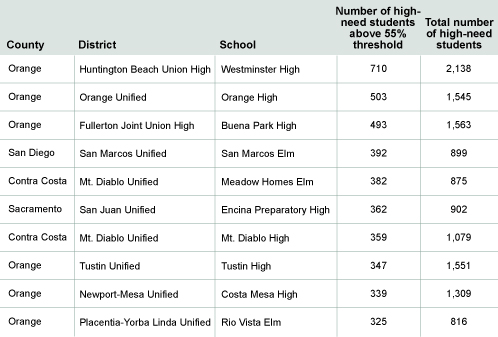
High-need students generate funding no matter how they are distributed. But because concentration grants are based on district-wide shares of high-need students, individual schools with shares that are above the concentration threshold do not get extra funding unless the district concentration is also above the threshold. Altogether, there are 677 schools in 154 districts above the 55 percent threshold that do not receive concentration funding because their districts are below the threshold. Table 4 contains a “top ten” list of these schools. Each has shares of high-need students well above 55 percent.
Table 4. Most of the High-Need Schools That Do Not Get Concentration Grants are in Southern California
SOURCE: Author’s calculations from CALPADS Unduplicated Pupil Count Source File.
NOTE: Excludes county office of education schools, non-school locations, State Board of Education, and Statewide Benefit charters, as well as nonpublic/nonsectarian schools, juvenile court schools, and youth authority facilities
Six of the top 10 of these schools are in Orange County, in different school districts. Statewide, there are 54,000 of these students-about 1.4 percent of all high-need students.18
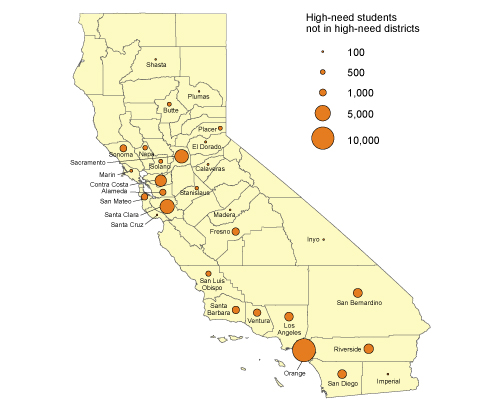
These high-need students are concentrated in a few counties (Figure 3). Orange County enrolls nearly 15,000 of these students (7% of all the county’s high-need students); Santa Clara has nearly 6,000, Sacramento has more than 5,000, and Contra Costa has nearly 4,000.
Figure 3. High-Need Students Who Do Not Generate Concentration Funding Are Clustered in a Few Counties
SOURCE: Authors’ calculations from CALPADS Unduplicated Pupil Count Source File.
NOTE: Excludes county offices of education schools, non-school locations, State Board of Education, and Statewide Benefit charters, as well as nonpublic/nonsectarian schools, juvenile court schools, and youth authority facilities.
In these and other counties with high-need schools in districts that are not high need, county offices of education will need to help districts distribute funding carefully.
Policy Implications
The success of the LCFF hinges on whether school districts are able to improve outcomes for students, especially those who are high need. We find that counties and districts with the largest shares of high-need students rarely have schools with larger shares of high-need students than the district as a whole. These districts are not likely to have trouble distributing funding to students who need it. The biggest cause for concern lies with districts that have relatively low overall shares of high-need students that are unevenly distributed across schools. These districts are most likely to be found in Orange and San Diego Counties, as well as in the Bay Area (Sonoma, Napa, San Francisco, Solano, Contra Costa, Santa Clara, and Santa Cruz Counties) and in Sacramento County. An additional potential problem is that these students are in high-need schools but not in high-need districts, and therefore do not generate concentration funding.
In their LCAPs, districts are required to develop explicit plans for distributing funding to their highest-need students. The LCAPs being implemented this year are the first step toward holding districts-and the county offices that approve district plans-accountable for meeting the objectives of the LCFF. In their first year of planning, many district LCAPs mention the distribution of supplemental and concentration funding but do not provide much detailed information. Some districts go beyond a basic mention-for example, Los Angeles Unified plans to distribute funding according to schools’ duplicated number of high-need students.19
The Local Control Funding Formula gives counties new responsibilities to make sure that districts use supplemental and concentration funds principally for the benefit of high-need students. LCAP evaluation rubrics20 to be adopted by the State Board of Education in 2015 may help districts and county offices assess their success in serving high-need students.
The years ahead will reveal whether the relationship between district LCAPs and district practices is strong enough to improve outcomes for high-need students. This relationship should be closely monitored by county offices of education and the State Board of Education.
Related reports are available on ppic.org: Paul Warren, Implementing Local Accountability in California’s Schools: The First Year of Planning and Caroline Danielson, Low-Income Students and School Meal Programs in California.
A technical appendix to this report is available on ppic.org.
Topics
K–12 Education Population