

Summary
Last year, the California Legislature passed a new law-the California Mathematics Placement Act-to address widespread concern over equity in the math placement process. The law is aimed at improving the measurement of student performance in order to move more students successfully through the high school curriculum. In this context, we surveyed California’s school districts during the 2015-16 school year to examine their placement policies right before the law took effect and to identify district needs for technical assistance while implementing the new law. We found that:
- Districts need help in determining how to proceed. Because the law leaves many details open to local interpretation, many districts are unsure about how to handle certain key elements. Teacher recommendations are a good example. Our survey indicates that the majority of districts have relied on recommendations as an important factor in determining placement. But the law now restricts their use. Improving the law’s clarity is critical going forward.
- Despite uncertainties, most districts are implementing the new law. Among our respondents, 86 percent reported having a systematic math placement policy. Sixty percent said they are somewhat or very familiar with the new law. Among these districts, 51 percent said they were already in compliance and 42 percent reported revising their policies for compliance purposes.
- Across districts, there is a strong need for valid, reliable, and objective performance measures. This need applies both to assessing student performance and to evaluating district policies. Districts with the largest gains in student course outcomes over a 10-year period provide some insight. These districts are more likely than others to emphasize test scores, math GPA, and overall GPA when assessing student placement. They are also more likely to use end-of-year math grades to evaluate district placement policies.
- Districts face a number of other challenges. Districts’ concerns range from handling parental expectations, to needing evidence-based performance measures, to creating better policy alignment within and across schools. In addition, equity issues and staffing shortages present ongoing challenges for many districts.
We recommend several actions for helping districts comply with the law and improve their math placement process. These include establishing evidence-based measures, refining the approach to teacher recommendations, and identifying effective placement protocols. In the longer term, districts would benefit from using student data to improve equity issues and from increased staffing, especially in rural and high-need districts.
Introduction
Improving student access-particularly among underrepresented students-to rigorous high school math courses is a necessary step to improving college readiness, increasing access to selective colleges, and closing the achievement gap. A number of recent state legislative efforts highlight the importance of course rigor in preparing students for college and beyond.1 In addition, the State Board of Education has approved a preliminary college and career readiness indicator, which leans heavily on student participation and performance in rigorous courses, such as a-g courses, advanced placement exams, International Baccalaureate courses, and dual enrollment in high school and college courses.2
Student participation in rigorous math courses is affected by district course placement policies-a set of rules that evaluate and determine the appropriate courses for students. Some placement criteria are based on student academic performance such as test scores, while others are based on non-academic factors such as student discipline and motivation. Placements can also be affected by parental involvement, teacher recommendations, and school characteristics (Lee and Bryk 1988; Useem 1992; Oakes and Guiton 1995).
Recent studies from California have pointed out inequities in the math placement process. For example, evidence suggests that some students placed in algebra in 8th grade were improperly placed in the same level of algebra in 9th grade, despite already having passed the class; this misplacement was found to have occurred more often to African American and Latino students (Waterman 2010; Lawyers’ Committee for Civil Rights of the San Francisco Bay Area 2013). Amid such equity concerns, the California Mathematics Placement Act (SB 359) is intended to create a fair, transparent, and objective math placement process. School districts create their own policies to meet these overall standards. However, the law requires districts to include certain practices, such as relying on multiple objective measures in placement decisions, using student performance data to ensure equity and efficacy, and ensuring the consistency of placement policies between elementary and high school districts.
Of the new law’s provisions, one issue stands out as particularly complex-the use of teacher recommendations. Many have raised concerns that teacher perceptions may not be objective and may be systematically biased against certain groups of students, particularly economically disadvantaged and minority students (Card and Guiliano 2015; Quazad 2014; Donovan and Cross 2002; Figlio 2005). The new law calls for the removal of teacher recommendations in placement decisions, unless these recommendations are used to advance students. But as we shall see, teacher recommendations are a complex measure, particularly in relation to equity concerns. Clarifying this issue will be a key component of successful implementation of the law.
For this study, we developed a statewide survey with detailed questions about district math placement policies, including the use of placement measures and the evaluation of district placement policies. The online survey was sent to all unified and high school districts in April 2016 and received a total of 305 responses. After excluding respondents whose districts could not be identified or who did not start the survey, our final sample includes 199 unified and high school districts. This translates into an overall response rate of 47 percent and a response rate for high school districts of 57 percent. Since large, urban, affluent, and better performing districts were more likely to respond to our survey, we weighted the responses, and our weighted sample is not statistically different from state averages on a wide range of student and school characteristics (see Technical Appendix A for more details). We supplemented our survey with follow-up interviews with 20 districts.3
Defining District Types
In the following analysis we report the weighted survey results, and when appropriate we also break down the results by the following district types:
High-need districts. Fifty-five percent of students in these districts are disadvantaged in some way’students may be English Learners, eligible for free or reduced-price lunch, in foster care, or any combination of these factors. In 2015-16, 52 percent of California’s unified and high school districts were high-need districts.
High-performance districts. These districts made the largest gains (e.g., were in the top quartile) in a-g completion from the 2004 to the 2014 school year, after controlling for student demographics and educational needs. (For a detailed discussion of this district type, see Technical Appendix C.)
Rural and urban districts. We base these distinctions on the 2013-2014 National Center for Education Statistics’ locale codes; in that school year, 13 percent of all unified and high school districts qualified as rural districts.
Small and large districts. These types are based on unified and high school district enrollment in 2015-16. Small districts had enrollments in the bottom quartile (with less than about 3000 students) and large districts in the top quartile (with more than about 20,000 students).
In the remainder of this report, we provide results from our survey on a number of key issues: awareness of and compliance with the new law, the identification of common measures used to place students, and the use of evaluation measures for district placement policies. We also report on some common concerns districts raised. Finally, we close with a number of recommendations for improving implementation of the law and helping districts to increase the effectiveness of their math placement policies.
Awareness and Compliance Vary across Districts
As of spring 2016, 60 percent of survey respondents reported being somewhat or very familiar with the new law and its requirements.4 Among these districts, 51 percent reported that their policy was already in compliance with the law and 42 percent reported they were revising their policies for compliance purposes. We found some variation by district type, mostly by geographic location and enrollment size. For instance, large districts were more likely to be aware of the law and report having a policy already in compliance; small and rural districts were less likely to do so (Figure 1).
Figure 1. Among districts familiar with new requirements, compliance varies by district type
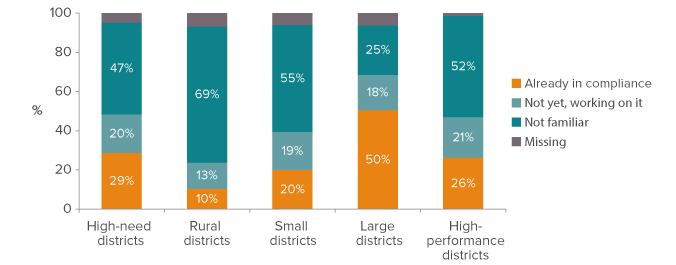
SOURCE: Math Placement in California Survey, PPIC 2016.
NOTE: Sample restricted to districts familiar with SB 359 requirements (60 percent of all respondents). All numbers weighted.
Eighty-six percent of unified and high school districts reported that they had a systematic placement policy in place for the 2015-16 school year. We found little significant variation by district type, except that more high-performance districts than high-need districts reported having a policy in place (98% to 80%), as Figure 2 shows.5
Figure 2. More high-performance districts than high-need districts report having a policy for 2015-2016
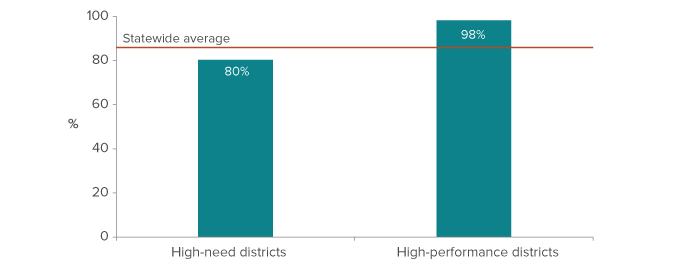
SOURCE: Math Placement in California Survey, PPIC 2016.
NOTE: All numbers are weighted. Statewide average is 86 percent.
Overall, we found that districts shared the same equity concerns that promoted the passage of SB 359-that is, making sure that all students are placed in the appropriate math course and provided necessary learning tools. In fact, an overwhelming majority of districts said that they believe the law is likely to result in more students being placed appropriately (Figure 3). However, high-need districts were less likely than other district types to report confidence in the efficacy of the new law.
Figure 3. Most districts think that SB 359 will result in more students being properly placed

SOURCE: Math Placement in California Survey, PPIC 2016.
NOTE: Sample includes districts that are familiar with SB 359 requirement. All numbers are weighted.
Despite this general optimism, designing a placement protocol that ensures success for all is a big challenge, especially when many districts are still working to establish reliable evidence-based measures. In the next section, we examine the measures that districts currently rely on and discuss the implications of one of the most common, teacher recommendations.
Placement Policies Rely Heavily on Three Measures
Districts use a combination of objective measures, such as test scores, and subjective measures, such as teacher recommendations, to determine the appropriate math courses for students. Our survey shows that across all district types the most common measures are test scores (94%), math GPA (91%), and teacher recommendations (87%) (Figure 4). These measures are also considered important, carrying greatest weight in district decisions. For instance, among districts using test scores, 90 percent also think that they are important. It is not clear, however, if one measure (e.g., math GPA) could override another (e.g., test scores) in the process.
Figure 4. Districts use a range of measures in their placement policies
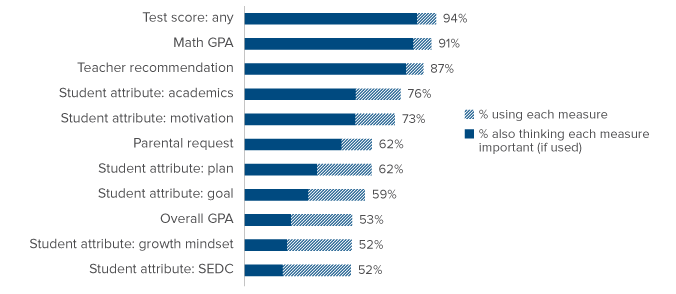
SOURCE: Math Placement in California Survey, PPIC 2016.
NOTE: Sample includes districts that are familiar with SB 359 requirement. All numbers are weighted.
Test scores, the most popular measure, encompass a wide range in both the number and the type of test used for placement (Figure 5). Among districts with a placement policy, 80 percent used two or more tests to assess student placement. The most common include state and district assessments, such as the statewide Smarter Balanced assessment (SBAC), district benchmark tests, and formative assessments’such as an algebra readiness assessment. Diagnostic exams such as the Mathematics Diagnostic Testing Project, Measures of Academic Progress, Renaissance Math, and Mathematics Assessment Resource Service are also used in placement decisions.
Figure 5. Districts use a wide range of test scores
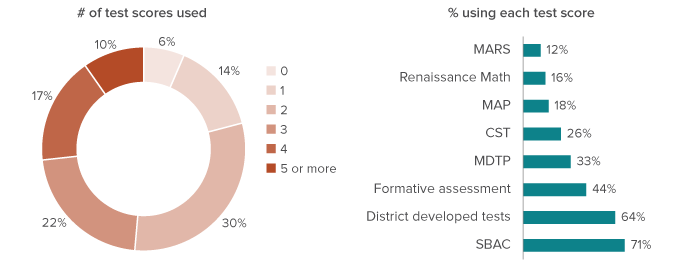
SOURCE: Math Placement in California Survey, PPIC 2016.
NOTE: All numbers weighted by inverse probability of responding.
A range of other measures are also important in district placement policies. After the top three, districts rely on student academics (76%)—that is, formal and/or informal assessments of student achievement-and motivation (73%). Notably, these top measures include a mix of cognitive skills and student attributes’such as motivation-that are sometimes referred to as soft skills. Other commonly used measures of soft skills include student course plans (62%), goals (59%) and “growth mindset” (52%). It is also worth noting that a majority of districts also rely on parental requests for math placement decisions (62%).
Measures vary across district type
We found significant variation across district type in the relative importance of various placement measures. For instance, high-need districts assign more weight to student attributes such as academic potential, motivation, and students’ own course plans. Small districts are also more likely to rely on student motivation, course plans, and goals. Large districts, which usually have the capacity and resources to develop their own readiness tests, put more weight on these tests and less on student attributes. High-performance districts predominately rely on test scores and student math GPA in their placement decisions. They are also more likely to rely on a range of test types when considering test scores.
Other important district characteristics affect student course placement. These characteristics, particularly enrollment capacity (the number of courses available) and teacher staffing (the number of math teachers available) tend to limit the number of math courses available. For instance, more than half of rural districts experience teacher shortages, as do a third of small and high-need districts (Figure 6). In fact, 22 percent of all districts-regardless of size, location, performance, or number of high-need students-are affected by enrollment capacity. Constraints on capacity and staffing mean some students are not advanced simply because schools do not have room for them, even if they are ready.
Figure 6. Staffing shortages affect many districts
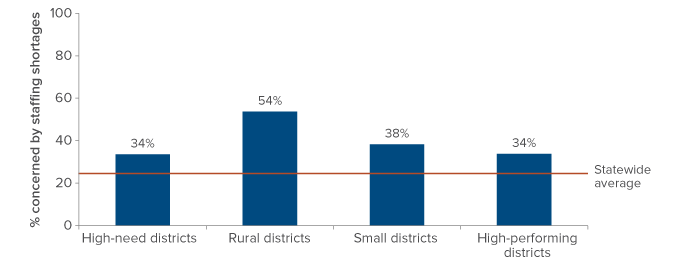
SOURCE: Math Placement in California Survey, PPIC 2016.
NOTE: The orange line indicates the statewide average (24%). All differences significant at 10 percent or below.
Clarifying and improving the use of teacher recommendations is critical
Under the new math placement law districts cannot rely on teacher recommendations for placement, unless they are used to advance students. However, the law is not clear about which components of teacher recommendations are acceptable or how recommendations should relate to other placement measures. Given the widespread importance of teacher recommendations in most districts-and the relative lack of clarity in the new law-it is essential for the state and districts to work on a clearer and more nuanced way to handle this critical measure.
Our survey does not reveal how teacher recommendations are actually used-whether they override other measures, whether they promote students who are short of meeting test score cutoffs, or whether they are used in some other way. But it is able to show what teacher recommendations are based on. And our follow-up conversations with districts revealed a complex situation, in terms of the use of this measure and its implications for equity in math placement decisions.
First, what are teacher recommendations based on? We found that teachers factored in a mix of cognitive and soft skills. Cognitive skills included academic performance, content mastery, and formative classroom assessments, while soft skills encompassed student motivation, persistence, maturity, and organizational skills. Both skill sets mattered, but cognitive skills were more frequently used (Figure 7). We found no meaningful variations across district types, except that teachers in large districts were less likely to consider formative assessments or student motivation in their teacher recommendations.
Figure 7. Teacher recommendations are based on cognitive and soft skills
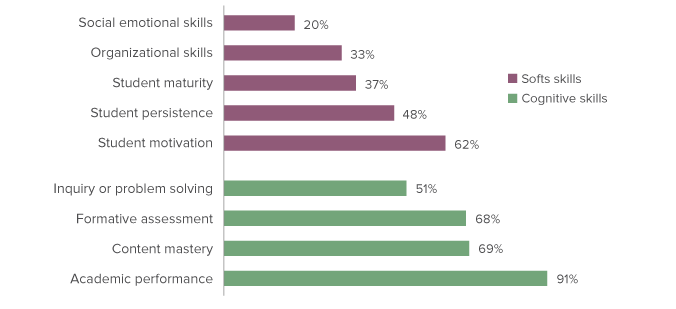
SOURCE: Math Placement in California Survey, PPIC 2016.
NOTE: All numbers are weighted. For a detailed discussion, please refer to Technical Appendix C.
These findings raise critical questions about the content and use of teacher recommendations. Should soft skills such as student motivation and persistence be included? Or should teacher recommendations be based solely on objective criteria such as classroom assessments? The fact that law restricts the use of teacher recommendations to promotions only suggests an acknowledgement of the need for the recognition of soft skills, which objective measures would not pick up. However, it is not clear that a sole reliance on test scores in teacher recommendations would meet the law’s equity goals. Indeed, many districts expressed concern about unintended consequences of such an approach. For instance, underrepresented students tend to have lower test scores, which do not reflect actual learning or predict future success.6 Relying solely on objective measures in teacher recommendations and hence the placement process may result in many underrepresented students being held back when they are capable of excelling in higher math courses.
Additionally, majorities of districts expressed concern about the reliability and validity of certain assessment measures (including test scores), and over the years some districts have designed an evidence-based teacher recommendation rubric that complements test scores by picking up student attributes that are important to student learning (such as student motivation). A removal of such a system would lead to many students not being appropriately placed.
District Toolbox: Handling Bias in Teacher Recommendations
First, how can districts handle potential bias in teacher recommendations? A practical way to safeguard against bias is to use student data to assess whether African American and Latino students were less likely to be promoted than their white and Asian American peers. Specifically, districts could select groups of students with similar test scores and determine whether certain minority students tended to have lower placements and/or teacher ratings. Any difference in placement decisions would indicate a potential bias in teacher recommendation.
Second and more important, how can districts ensure teacher recommendations are predictive of student learning outcomes? After removing bias, the next step is to ensure that teacher recommendations are picking up student characteristics not captured by other measures but are important to student learning. A simple way is to examine the association between teacher recommendations and student outcomes. For instance, take students with similar test scores but different teacher recommendations (which presumably reflect characteristics that are not captured by test scores) in pre-algebra. If students with higher teacher ratings do not outscore those with lower ratings in subsequent assessments (such as the end-of-course algebra exam or the SBAC), then the district would need to revisit their teacher recommendation rubric.7
Given the drawbacks of using subjective and objective measures in isolation, moving forward the critical question may be not whether teacher recommendations should be used, but how they could be reengineered to complement objective measures (see “Handling Bias in Teacher Recommendations’ above). Through review and analysis of teacher recommendations, districts may be able to avoid holding back students inappropriately while at the same time advancing students who do not perform well on tests but are capable of succeeding in a higher math course.
Measures to Gauge District Success Focus on Grades and Test Scores
In our survey we asked what metrics districts use to evaluate the success of their policies.8 Evaluation is an important step in implementing any new policy, both to ensure policy effectiveness and determine whether any changes are needed.
We found that only 8 percent of districts have no form of evaluation. The rest mostly rely on student learning outcomes to gauge the effectiveness of their placement protocols. More than half of districts use a number of outcome measures, including student end-of-year math grades, the percent of students advancing to the next level of math courses, student performance in state standardized tests, and teacher feedback on student outcomes (Figure 8). There is not much meaningful variation across district types, except that rural districts are less likely to use the percent of students advancing to the next math course, teacher feedback, and student feedback while high-performance districts are less likely to use student feedback.
Figure 8. Numerous measures are used to evaluate placement policies
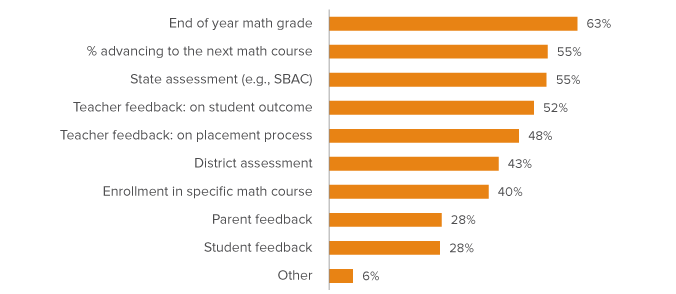
SOURCE: Math Placement in California Survey, PPIC 2016.
NOTE: All numbers are weighted. All differences shown are significant at 10 percent level or better.
Districts share other concerns
To evaluate whether districts have the right tools to implement the math placement law, we provided districts the opportunity to write in the challenges they have or that could arise when placing students into the right math course.9 The new law attempts to address some of the following concerns, but district feedback suggests that there is much room for improvement. Here, we discuss the top five challenges, from the most to least frequently mentioned.
Unrealistic parental expectations
The most frequently cited challenge had to do with high parental expectations. The majority of district policies allow parental waivers, a process in which parents can override school placement decisions. While parental involvement is an important aspect of local decision making, particularly in the era of the Local Control Funding Formula, it sometimes causes unintended consequences-especially when parents are misinformed. For instance, districts reported that many parents believe it is always better for students to move quickly through the math curriculum. But this belief oftentimes means that students are accelerating too fast or too early-particularly when they are not ready. The misalignment between parental expectations and student preparation can lead to overplacement, in which students find themselves struggling in advanced math courses. The problem is exacerbated when districts do not provide the necessary support to help these students. Additionally, some districts reported that they do not have an option for these students to go back to a lower level of math courses, making it even harder for struggling students to get back on track.
The new law touches on communication with parents, requiring that all districts publish their placement procedures on their website. While this may provide parents with more accurate information, it does not directly address unrealistic expectations. Districts may want to look for ways to use their websites and other communications tools to specifically address the challenges of overplacement.
Lack of evidence-based readiness measures
While districts use a variety of measures-from test scores to student motivation-to help place students, they expressed concerns that some measures may not be valid or reliable. The drawback of objective measures, such as test scores, is that they may be biased against students who are not good test takers, as well as against low-income and/or minority students, who tend to have lower scores that do not reflect actual knowledge or predict future success (Steele 1997; Rothstein 2004; Hoffman and Lowitzki 2005; Madaus and Clarke 2001). However, subjective measures such as teacher recommendations may hold back the same students if teacher bias is involved (Card and Guiliano 2015; Quazad 2014; Donovan and Cross 2002; Figlio 2005). How to establish a set of evidence-based readiness measures, and how to balance the use of subjective and objective measures continues to be a big challenge. Because this is an issue of central importance to the success of the law, we discuss it at greater length in the next section.
Poor alignment and communication, within and across schools
The new Common Core math standards affect course sequencing, course content, and, consequently, course placement. Miscommunication around the new standards emerged as an important theme, as did misalignment of course content and expectations. These problems manifest in three ways.
First, districts reported that some students and parents do not have a good understanding of the new math curricula and its implications for placement. Some parents do not know what is expected in Common Core math. For example, in some districts, early acceleration is no longer an option. Misunderstandings could happen if parents were not provided with enough resources during the transition to Common Core. A recent statewide poll suggests that two years into Common Core implementation, 35 percent of public school parents said they were not provided adequate information about the new standards and 22 percent received some information but felt they needed more (Baldassare, Bonner, Kordus, and Lopes 2016).
Second, not all teachers grasp the new math content, resulting in inconsistent instruction within and across schools. Third, there is a misalignment between expectations among middle school teachers and those of high school teachers on what students should know. There can even be misalignment within the same course. For instance, students getting a “B” in pre-algebra may be considered unprepared by the standards of a different pre-algebra class.
Districts need to continue to educate students and parents on Common Core. They also need to provide teacher training so that the new math content is taught effectively and consistently, both within and across schools.
Equity
Designing a placement protocol that ensures success for all is a big challenge. For instance, districts are concerned that their placement policy may disadvantage low-income and minority students because these students tend to have lower test scores and because of potential bias in teacher recommendations. Districts also expressed concerns that low-income and/or minority students may be further disadvantaged because they may not have home support or cannot afford a tutor, making it difficult to learn outside of school settings. Because equity is one of the core concerns of the law, we will take up further discussions of this issue in the next section.
Teacher staffing
The law addresses some of the concerns mentioned above, however, it does not appear to address teacher staffing, which is critical to ensure that all students have access to quality math courses. In high-need, rural, and small districts teacher staffing is a constant problem. Lack of resources can potentially lead the new placement law to fail, as students may be under-placed simply because schools cannot offer enough courses. Resources for these districts are a long-term problem, but viewed in light of the math placement policy, it is more critical than ever that districts and the state work together to resolve it.
Conclusion
The California Mathematics Placement Act is intended to help school districts make significant progress in ensuring all students, particularly underrepresented students, have access to rigorous math courses-and are thus better prepared for college and careers. Our survey found that the majority of districts (79%) believe that the new law will result in more students being placed in appropriate math courses. At the same time, reform brings new challenges. As state and local policymakers find ways to improve student participation and performance in rigorous courses, we offer the following recommendations.
Clarify the use of teacher recommendations. The new law leaves certain issues unspecified, including compliance with the provision regarding teacher recommendations. Policymakers should consider specifying what compliance in this area means. Our survey reveals that teacher recommendations are among the most widely used measures in district placement decisions, and that these recommendations rely heavily on both the cognitive and the soft skills that contribute to student learning. During our follow-up conversations with districts, we found cases where teacher recommendations are biased against high-achieving minority students; we also found cases where teacher recommendations are advancing minority students who do not test well on standardized tests. Therefore, eliminating teacher recommendations altogether may help some students but at the expense of others. The critical issue is not whether teacher recommendations should be used but how they could be designed to complement objective measures.
Identify valid, objective, and reliable measures of student performance. To balance the subjective aspects of measures such as teacher recommendations, districts need evidence-based measures that accurately reflect student learning. State assessments, which are given annually to tested grades, do not cover student learning in non-tested grades or assess student learning during the year. But district-developed assessments may not have the same internal and external validity as statewide tests.
Provide guidance on the use of subjective and objective measures to ensure they have the proper balance. When used in isolation, each measure has its own drawbacks. The critical issue is to design a system in which these measures complement each other. From a state perspective, this could be achieved by establishing a network of diverse districts and using a detailed database, such as student transcripts, to pinpoint measures that are closely related to student course outcomes. Another way is for future research to examine placement protocols in high-performance districts, since they have been successful in improving student outcomes. In the absence of such a guideline, local districts may use their student data to detect and remove any potential bias in teacher recommendations, which we discussed earlier in this report.
Pinpoint measures that demonstrate district success. To guide local practices and identify areas for improvement, districts need to gauge their own success. Measures that could help to do so include end-of-year math grades, the share of students advancing to the next level of math, or state assessment scores. More than half of districts are already using these measures to evaluate their effectiveness and we encourage the rest to do the same. A practical way is to integrate metrics into districts’ Local Control Accountability Plans (LCAP) process. The intention is not to punish or criticize districts, but to evaluate their placement protocols and identify areas for improvement. At the same time, policy efforts should also focus on building a support system that helps districts improve.
Use student data to assess and revise placement guidelines. Districts may use these data to assess equity concerns-a critical motivator of the law itself. For example, districts could evaluate fairness in student promotion by analyzing whether minority students who have similar test scores as white students are less likely to be promoted. Districts may also use these data to see if a specific measure, such as test scores or teacher recommendations, is predictive of student course outcomes. To further ensure that the new policy is helping the very students it intends to help, we also recommend breaking down data by student subgroups. A data driven decision-making approach above would help to make sure that students are placed properly.
Address capacity concerns. Staffing shortages continue to present a challenge, particularly for rural and high-need districts. Decision makers at both the local and state level who are concerned about access to math courses must meaningfully address this challenge if the goal of equitable access to advanced math courses is to be achieved. More than half of rural districts and a third of high-need districts report not having enough teachers or staff, despite years of investments in teacher induction and support programs (Legislative Analyst’s Office 2016).10 In the long run, the state should continue and expand its current programs to prepare, recruit, and retain high quality math teachers, particularly in hard-to-staff areas. In the short run, the state could also provide online or virtual academies in areas where rigorous math courses are limited.
This study is a first step to identify and scale up effective math placement protocols. Ideally, future work would rely on a detailed student database’such as student transcript data-to address centrally important yet understudied issues in math placement, including the identification of reliable and accurate measures of student outcomes, the establishment of protocols associated with growth in student outcomes, and the consequences of effective support systems for improving student learning.
Meanwhile, California’s recent efforts to address math placement-and to meet the ambitious goal of equal access for all students-are steps in the right direction. It will be critical to monitor district progress and state support to make sure that these efforts result in better outcomes, for the sake of California’s students and the progress of the state.
Topics
K–12 Education