- California’s prison population has stabilized.
Since 2017, California’s institutional prison population has hovered at about 115,000 inmates—just below the Supreme Court mandated target of 137.5% of design capacity—the number of prisoners the system was built to house. However, 13 of the 35 state-owned facilities individually operate beyond that capacity. About 15,000 additional inmates are not counted in the institutional population because they are housed in camps or in one of the eight contract facilities that the state does not own. Four contract facilities are privately operated; three are publicly operated by the cities of Delano, Shafter, and Taft; one is privately owned but operated by the California Department of Corrections and Rehabilitation. By June 2019, all of the prisoners formerly housed out of state—more than 10,000 in 2011—had been returned to facilities in California.
Many prisoners still live in overcrowded prisons
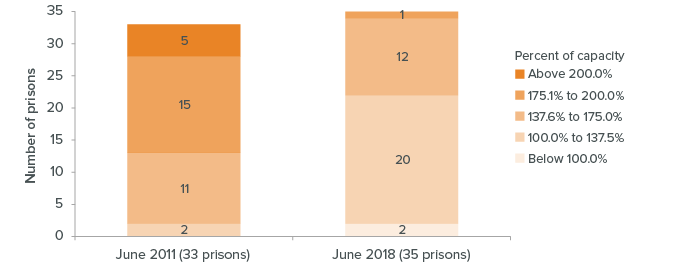
SOURCE: California Department of Corrections Monthly Population Reports.
NOTES: Inmates housed at the California Health Care Facility and women housed at Folsom State Prison are represented in 2018, but not in 2011 because neither facility was operational then. The Supreme Court mandated target applies systemwide, not to individual prisons.
- African Americans remain overrepresented in California’s prison population.
In 2017, the year of most recent data, 28.5% of the state’s male prisoners were African American—compared to just 5.6% of the state’s adult male residents. The imprisonment rate for African American men is 4,236 per 100,000 people—ten times the imprisonment rate for white men, which is 422 per 100,000. For Latino men, the imprisonment rate is 1,016 per 100,000; for men of other races it is 314. African American women are also overrepresented. Of the state’s 5,849 female prisoners, 25.9% are African American—only 5.7% of the state’s adult female residents are. African American women are imprisoned at a rate of 171 per 100,000—more than five times the imprisonment rate of white women, which is 30 per 100,000. Imprisonment rates for Latino women and women of other races are 38 and 14 per 100,000, respectively. - Foreign-born Californians are less likely to be imprisoned.
Most inmates in California were born in the United States—81.4%, more than the 65.4% of adult US-born Californians. By contrast, just 13.5% of the state’s prison population was born in another country (5.1% of inmates are of unknown national origin), while California’s adult immigrant population is 34.6%. Among prison inmates, 8.6% were born in Mexico and 3.7% were born in other countries. In California overall, 13.2% adult residents were born in Mexico, and 21.5% were born in other countries. - The prison population is aging—and health care costs are on the rise.
Between 2000 and 2017, the share of prisoners age 50 or older more than quintupled, from 4% to 23%. During the same time period, the proportion of prisoners younger than age 25 halved, from 20% to 10%. The average male prisoner is now almost 40 years old. The average female prisoner is slightly younger, at 38. Aging prisoners may be contributing to California’s prison health care costs—now highest in the nation. The state spent $19,796 per inmate on health care in fiscal year 2015, according to the Pew Charitable Trusts. These costs were more than three times the national average and 25% more than in 2010. - Many prison inmates serve decades—or more—before being released.
Many of California’s prisoners—about 55,000—will be released after they serve about half of their 4-year sentences. But the majority will be imprisoned for much longer. About 33,000 inmates are “second strikers,” about 9,000 of whom are released annually after serving about 3.5 years. Another 7,000 are “third strikers,” fewer than 100 of whom are released annually after serving about 17 years. Approximately 33,000 inmates are serving sentences of life or life without parole. Fewer than 1,000 of these inmates are released every year, typically after spending two or more decades behind bars. - Most prisoners have current or past convictions for violent or serious crimes.
The most common crimes that led to imprisonment in 2017 involved assault, weapons, or robbery, all of which are serious and violent crimes. In addition, 91% of all prisoners had criminal records that included convictions for violent or serious crimes. Eighty percent of all inmates were admitted to prison after being convicted of such a crime.
Half of the prisoners admitted in 2017 were convicted of an assault, robbery, or weapons charge
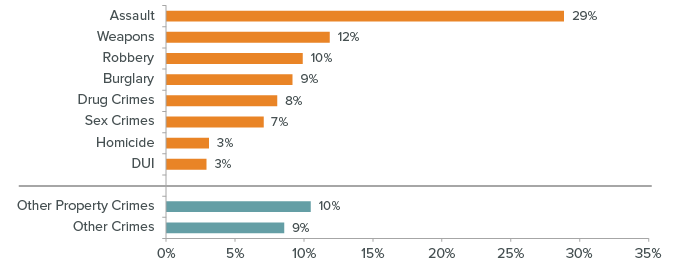
SOURCE: California Department of Corrections Offender Data Points as of December 31, 2017.
NOTES: Assaults include assault, battery, and attempted murder. Homicides include murder, manslaughter, and vehicular manslaughter. Most admissions for drug crimes are related to sales and manufacturing. Sex crimes include rape, child molestation, indecent exposure, and failure to register as a sex offender. Most other property crimes are theft related, including fraud, motor vehicle theft, petty theft, and grand larceny, but property offenses also include crimes such as extortion and vandalism. Other crimes include arson, escape, hit and run, reckless driving, and stalking.
Topics
Criminal Justice Population