Voter turnout in California correlates with a series of individual demographic characteristics. Demographic groups with relatively low turnout include registered voters of color and young adult voters. Among underrepresented voters, gaps in income, education, and information often compound histories of exclusion. As a result, California’s electorate does not accurately reflect the state population and may not be adequately serving that population’s needs.
But political life is not always about individuals; it is often lived in geographic space. Elected officials represent specific communities, voter mobilization focuses on neighborhoods, and many policies target particular places. Given that some of the most competitive congressional races this election cycle are in California, it is worth taking a step back to see how many communities are underrepresented and how much potential there is to engage them. (See our interactive feature for detailed registration data by geography.)
Presidential elections typically produce relatively high voter turnout that shrinks demographic gaps. Even so, there are significant differences in participation across communities. The registered voter file contains a record of the turnout history for each current registrant, regardless of where in the state they happened to live at the time of these past elections. (The 2020 turnout shown for each district is based on the voting history of current district residents; district boundaries changed between the 2020 and 2022 elections.) These histories vary by 20 points or more across the census tracts in each congressional district, even for the high-profile 2020 presidential contest. Such gaps in participation are all the more remarkable because they occur among Californians who have demonstrated a certain level of engagement by registering to vote.
The figure below shows that the most competitive congressional districts this cycle are no exception to this pattern. The tracts in each district with the highest 2020 turnout history fall mostly above 90% turnout, while the lowest-turnout tracts mostly fall at 75% or below.
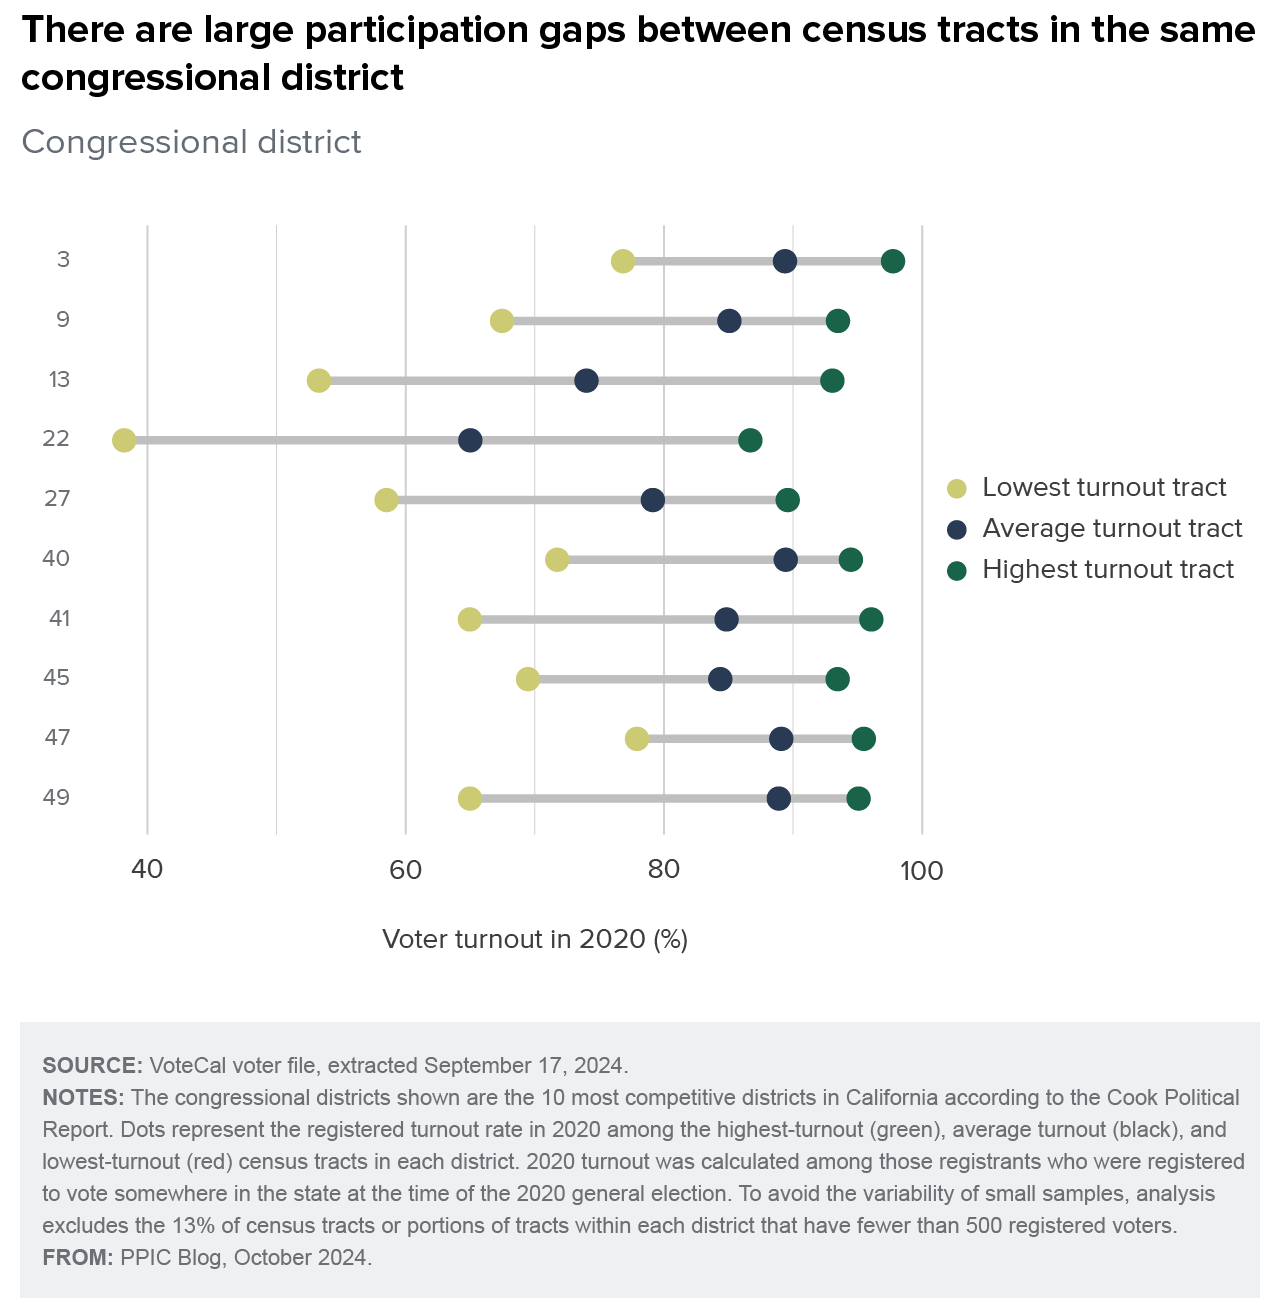
The communities with the lowest turnout histories in these ten districts share several characteristics. They typically have larger Latino and African American voter populations, larger shares of foreign-language voters, and greater proportions of young voters (aged 18–24). (Asian American voters on average have lower turnout rates than white voters, but the size of the Asian American population in a given census tract is not consistently indicative of a low-turnout community.)

Lower turnout rates have often persisted across elections. Almost three-quarters (72%) of each district’s low-turnout tracts in 2020 (those with turnout histories in the bottom 20%) remained low turnout in 2022 and 2024. In fact, in 19 of California’s 52 congressional districts, the same tract had the lowest turnout history in all three elections.
Not all the news is discouraging. Some communities have increased turnout from one election to the next: 35 tracts that have low turnout histories for 2020 manage to rise above the 50th percentile in either the 2022 general election history or the 2024 primary history. And while it is typical for turnout to fall in non-presidential elections, the histories in many low-turnout tracts manage to avoid the biggest post-presidential declines. The tracts with declines between 2020 and 2022 that are smaller than the 50th percentile include over 400 tracts that are low turnout for 2020; almost 700 low-turnout tracts fit the same bill in 2024. Identifying the features these tracts share might illuminate opportunities to promote more consistent engagement.
The persistence of geographic disparities in election participation is certainly a challenge, but it is also an opportunity. Voters in these underrepresented communities have already taken the crucial first step by registering, and their votes could be decisive in election outcomes. Understanding where participation gaps exist and targeting resources accordingly can help ensure that every community has an equal voice in our electoral process.
Topics
civic engagement competitive districts elections Political Landscape presidential election racial disparities voter registration voter turnout votersLearn More
How the Voter’s Choice Act Changed Turnout in California
Turnout Levels and Latino Voters Create New Voting Patterns in California
Which Californians Turned Out to Vote in 2024?

California’s Voter Turnout Sank in 2024

Who Is Switching Political Parties in California?

How Are California’s Competitive Congressional Districts Changing?
The Political Views of Young Californians