
Key Takeaways
The digital divide has been an issue in California for decades. Its contours in the educational realm emerged more clearly than ever during the COVID-19 pandemic, when school facilities closed and instruction went online for nearly everyone. The Emergency Connectivity Fund (ECF) was a federal pandemic-relief program intended to improve digital access, whose mission included a particular emphasis on school districts serving students who would otherwise lack that access, including English Learners (ELs), Black and Latino students, and low-income students.
In this report, we examine the ECF program’s history to determine which school districts applied for funding, what kinds of needs their students and constituent communities were facing at the time, and what they purchased with their approved funds. As the program is scheduled to finish in June 2024, we highlight what remains to be done, and the existing resources that could be marshaled. We find:
- Districts with high shares of ELs, Black and Latino, or low-income students applied for ECF funding in greater numbers. Districts with high shares of ELs, Black and Latino, or low-income students made use of the federal resource more heavily than those without.→
- Those districts also secured sizable shares of funding. ECF applications from districts with high shares of those historically underserved student populations were approved for higher amounts of per-student funding than their counterparts.→
- Internet connectivity purchases dominated ECF funding applications. Regardless of the nature of the student population, districts applied in much greater numbers for assistance with internet connectivity than for funding to purchase connected devices.→
- ECF funding was a good start, but there’s much left to do. Districts serving vulnerable student populations estimated that between 9 and 15 percent of their students’ connectivity and device needs would still go unmet, even after the ECF funding and the districts’ own efforts.→
- Resources are still available for these efforts. Several federal and state programs are still in operation to assist districts’ efforts to deliver connectivity and devices to their students.→
Introduction
When the COVID-19 pandemic began in March 2020, 40 percent of student households lacked access to high-speed internet and a connected device. After a year of intensive efforts to connect students to remote learning because of school closures, that figure had fallen to 29 percent (Starr et al. 2022). Early pandemic recovery efforts focused on reopening schools safely as well as on facilitating digital access. Local educational agencies (LEAs) used resources to provide devices for accessing instruction, but for many students, connection to the internet remained out of reach.
In March 2021, Congress passed and President Biden signed the American Rescue Plan Act. In part, it authorized the Emergency Connectivity Fund (ECF) to help schools, districts, libraries, and regional consortia provide internet connectivity and connected devices to their students, staff, and patrons. LEAs used new and existing federal programs such as the ECF to address their concerns about unequal access for students.
Educational entities eligible to participate in the Federal Communications Commission’s (FCC) E-rate Program or the Library Services and Technology Act were also eligible to apply for the ECF. Applicants could request funding to purchase internet service, equipment for connecting to the internet (like routers, modems, or hotspots), or connected devices suitable for completing schoolwork (such as laptop computers and tablets). In certain cases where no other option existed, applicants could request funds to construct new networks to establish a high-speed internet connection.
The FCC estimates that ECF funds enabled some 8 million new broadband connections and purchased some 13 million devices nationwide. California entities requested approximately 15 percent of the total. School districts took advantage of these federal funding opportunities—submitting nearly two-thirds of the state’s over 2,000 unique ECF applications.
The last ECF application window closed in May 2022, with purchases required by June 30, 2024. The FCC is now preparing to close out the program, having committed over $7 billion nationwide in funding designated for some 18 million beneficiaries. Nevertheless, other sources of support for improving access to the internet remain. Several federal and state programs provide billions for connectivity for targeted populations, and the lessons we draw from the ECF could help improve their efficacy. For example, in California, SB 156 provides more than $6 billion for infrastructure and digital literacy, prioritizing historically underserved communities.
At the federal level, the FCC’s Rural Digital Opportunity Fund targets homes and small businesses in rural, previously underserved areas. It will award more than $20 billion over 10 years to internet service providers who commit to delivering high-speed, low-latency connectivity to qualifying census blocks. For rural, medium-, and low-income areas and tribal communities, the Treasury Department’s Coronavirus Capital Projects Fund provides $10 billion for broadband service and other infrastructure purchases to be made through 2026. Additionally, the federal Broadband Equity, Access, and Deployment (BEAD) Program makes over $40 billion available to states for expanding access to high-speed internet.
Now that schools have reopened for in-person instruction, many of the technological innovations adopted during the pandemic have become permanent features of instruction and assessment. But barriers related to infrastructure, affordability, and digital literacy have persisted, particularly among certain populations. Access has remained lower for English Learners (ELs), Black and Latino students, and low-income students.
Post-pandemic, connectivity remains an essential element of instruction and practice. Online platforms for giving, completing, and submitting assignments such as Canvas, instructional and research tools such as Khan Academy, and grading/reporting services such as Aeries have become standard in many districts, and students and parents are expected to use them. Although we don’t cover it in this report, digital literacy is an essential element that goes hand-in-hand with access: providing training and support for students and their families in the appropriate cultural and linguistic context. Of course, this is particularly relevant for the high-needs student populations we address here: ELs, Black/Latino, and low-income students.
We can learn from the measures that school districts took in leveraging resources to improve access to online learning when that was the only option. We can examine the degree to which the provision of those resources varied with the student population those districts served. And policy makers can apply those lessons to current and future efforts to provide districts with needed connectivity resources.
In this report, we examine school districts with high percentages of students who are English Learners (ELs), Black or Latino, or low-income, and compare them to districts without such high percentages. How likely were they to apply? How much funding were they ultimately approved to receive? What services or products had they requested to purchase? What progress were they able to make in providing their underserved students with internet access and/or a device?
What Types of Districts Applied to the ECF?
When the pandemic hit, schools closed for in-person instruction. They began to re-open later, but on widely varying timelines. As Figure 1 shows, though federal and state funding directed at augmenting online instruction began early on, they too were staggered. For example, the ECF itself was only authorized in March 2021. Last to resume was standardized testing, and only then were we able to discover the extent of learning loss and subsequent recovery in math and ELA proficiency. Since access to online learning has been critical throughout the four-year timeframe, so is this roadmap for assessing the efficacy of how districts used the ECF.
Timeline of pandemic-related events

SOURCES: FCC Emergency Connectivity Fund data, 2021–22; Lafortune et al. (2023).
NOTE: Learning loss and recovery as measured by statewide standardized assessments.
Comparing data compiled from the public access ECF application records and California Department of Education (CDE), we find that applicant districts have a total enrollment of 4.1 million students—69 percent of California’s 5.9 million. Demographically, their student composition is comparable to the state’s full set of districts (Figure 2). In the ECF applicant group, students enrolled in rural districts constitute 3 percent of the population—very similar to the statewide district total. But students in urban districts are over-represented—50 percent versus 32 percent statewide. For a deeper discussion of the data, how we used it, and its limitations, see Technical Appendix B.
ECF applicant districts generally reflect California’s student population

SOURCES: Authors’ calculations using ECF data, 2021–22; CDE data, 2021–22.
NOTES: We divided California school districts into quartiles—four equal-sized groups arranged by the percentage of English Learners in each group. Of 574 unique ECF-applicant districts with a total of 2,206 applications, we were able to match 465 (1,810 applications) to CDE district data using a fuzzy match merge on applicant name and county.
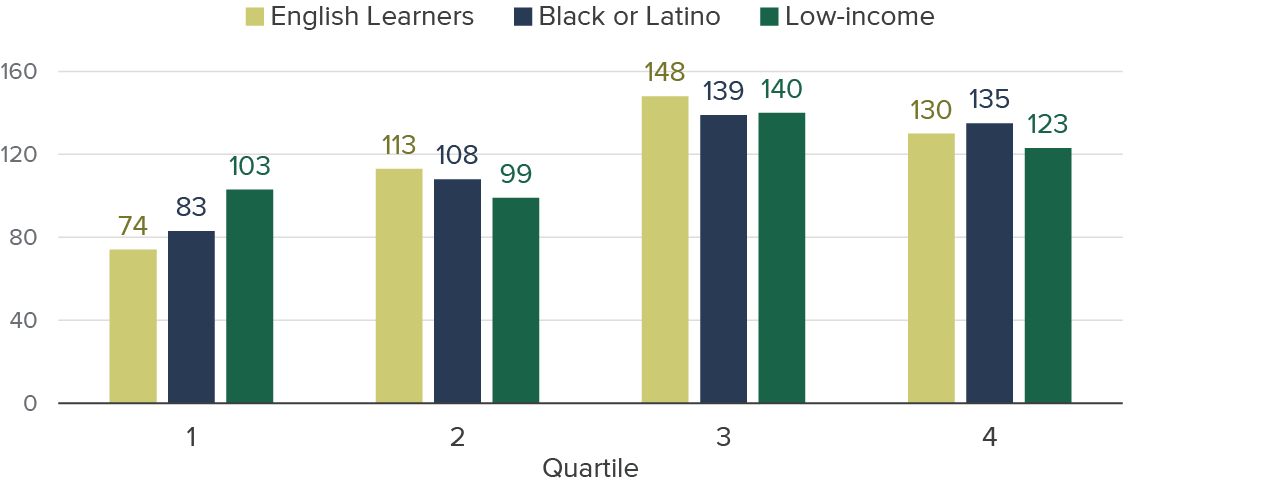
Districts with high concentrations of students from historically underserved populations applied to the ECF—shown in Figure 3. Districts with varying shares of ELs see the most pronounced differences: we find that 187 districts with below-median and 278 with above-median shares applied. Less pronounced but similar patterns obtain when comparing the distribution of applicants from districts with varying populations of Black, Latino, and low-income students.
Historically underserved districts constituted the majority of ECF applicants
SOURCES: Authors’ calculations using ECF data, 2021–22; CDE data, 2021–22.
NOTE: There were 465 fully identifiable unique applicant districts common to these two data sources. Each set of columns shows the number of ECF applicant districts from that quartile of the respective population of California districts.
How Existing Need Affected Applications
What level of internet service was available to districts applying to the ECF? Although the difference between rural and urban districts is dramatic, we see little difference between districts serving high and low shares of ELs, Black/Latino, or low-income students (Figure 4). It is also worth noting that although connectivity levels may be high on average in urban areas, coverage may be uneven from neighborhood to neighborhood (Hayes et al. 2023).
Urban districts had much greater connectivity capacity than rural districts
Average capacity (mbps)

SOURCES: Authors’ calculations using CDE data, 2021–22; K12HSN capacity data, 2024.
NOTE: We divided districts into quartiles of connectivity capacity and matched the records to our district and ECF data to observe the behavior of districts with greater or lower existing capacity.
Data from the K–12 High Speed Network (K12HSN) program provide information on connectivity capacity, allowing us to observe each district’s existing download and upload capability. Districts with the highest capacity were much more likely (64%) to submit an application than were their low-capacity counterparts (37%) (Figure 5). At first glance, this appears to concur with previous studies’ findings that wealthier and larger districts have greater ability to apply for public funding matching grants. But perhaps this should not be surprising. At the district level, connectivity capacity has a low correlation to the percent of EL (0.06), Black and Latino (0.12), and low-income students (0.06). Many urban, high-poverty districts serve large proportions of students from these underprivileged populations. But they often also have great capability to apply for grants and/or leverage their size, personnel, and institutional expertise to provide high levels of service at the school site.
As it happens, this particular measure of district-level connectivity capacity does not correlate reliably with districts serving our high-need populations of interest.
High-capacity districts were more likely to apply for ECF funding than those with low capacity

SOURCES: Authors’ calculations using ECF data, 2021–22; K12HSN capacity data, 2007–2024.
NOTE: K12HSN measures capacity as the speed of a district’s symmetrical circuits, meaning that it can download and upload data at that maximum speed.
ECF Applications and Reopening Schedules
As a whole, California was behind most other states in its districts’ reopening schedules, and there was considerable variation between—and even within—district types (Johnson 2021; Cano and Bikales 2020). Districts with historically underserved student populations tended to open later than the state average (Technical Appendix Figure A1). These variations also appear in ECF applications. Districts that reopened sooner appear somewhat less likely to have applied—37 percent of non-applicant districts had reopened by the end of 2020, as compared with only 20 percent of applicant districts. Districts that opened in fall 2020 and spring 2021 were typically non-applicant districts, but that difference largely closed by April 2021 (Figure 6). In each case, the most common month for reopening was April 2021.
Earlier-opening districts were less likely to apply to the ECF than those opening later
Cumulative districts reopened

SOURCES: Authors’ calculations using ECF data, 2021–22; California Department of Public Health data, 2020–21.
NOTES: Amounts shown are the cumulative percentages of each type of district that opened for in-person education for all grades at all of its schools during that month. ECF Application windows: 1) Jun 29 to Aug 13, 2021; 2) Sep 28 to Oct 13, 2021; 3) Apr 28 to May 13, 2022.
Learning Loss
Standardized state testing—i.e., the Smarter Balanced Assessment Consortium (SBAC) assessments (part of the California Assessment of Student Performance and Progress (CAASPP) system)—was suspended in spring 2020, and optional in 2021. The test became mandatory again in spring 2022, and those results constitute the first statewide evidence we can use to examine the pandemic’s impact on student learning.
Compared to the 2018–19 test scores, average proficiency decreased by 6 percentage points in math and 4 percentage points in English Language Arts (ELA), effectively erasing years of steady growth since 2014–15 (when the test first became operational). The decline is greater among high-EL districts—7 and 5 percentage points, respectively (Technical Appendix Figures A2 and A3).
Importantly, district learning loss measures show no correlation with ECF application. Districts that applied for ECF funding had a 6.1 percentage point decline in math proficiency during that same interval (2019–2022), and a 4.6 percentage point decline in ELA. Non-applicant districts looked very similar, with 6.2 and 4.7 percentage point proficiency declines in each subject (Technical Appendix Table A4).
Learning Recovery
As with district learning loss measures, learning recovery measures show no notable correlation with ECF application. Applicant districts recorded a 0.8-point improvement in proficiency rates in math, but a continued decline of 0.6 points in ELA. Non-applicant districts improved by 1.2 percentage points in math and dropped 0.2 points in ELA.
Initial learning recovery appears to be greater among high-EL districts: average math proficiency bounced back by 1.7 percentage points, compared to 0.5 percentage points among low-EL districts and 1.1 percentage points among all districts statewide. In ELA, however, there was little change in proficiency rates among high-EL districts, but a continued drop of 1 percentage point among low-EL districts and 0.4 percentage points statewide. Similar patterns emerge among high-Black/Latino and high-poverty districts—each saw a recovery of about 2 percentage points in math proficiency in 2023, but less than 0.5 in ELA.
In every case, outcomes were more improved among the districts with high concentrations of these underserved student populations of interest; low-EL, low-Black/Latino, and low-poverty districts all had smaller gains in math and, in fact, continued to see declines in ELA (Technical Appendix Figures A5 and A6).
How Were ECF Funds Distributed?
Most of the $859 million in California’s ECF funding went to districts with high concentrations of historically underserved populations. This is in keeping with the ECF’s mandate, which is to provide connectivity and devices to those “who would otherwise lack access” during the pandemic. The deadline for purchasing connectivity or equipment for applications submitted in the last filing window is June 30, 2024. The FCC continues to publish estimates of the number of broadband connections (8 million) and device purchases (13 million) the ECF has enabled, and how many students have benefitted (18 million) nationwide so far. The ultimate impact of these applications, the money awarded, the subsequent purchases, and outcomes for students has yet to be determined.
Funding Amounts Awarded by District Type
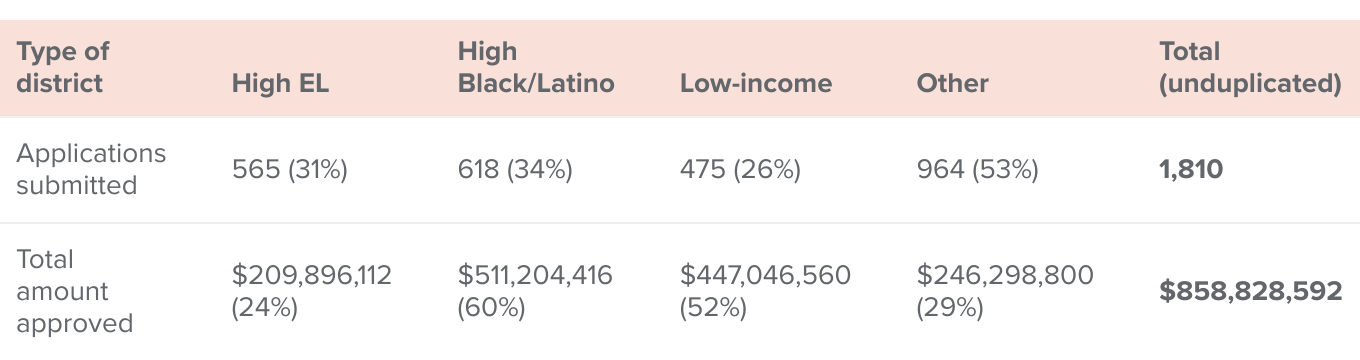
As Table 1 shows, high-EL districts—those with more than 25 percent of students classified as English Learners—submitted 565 unique applications and secured $210 million. Districts with high shares (i.e., over 75%) of Black or Latino students submitted 618 applications and were approved for $511 million. Districts with over 75 percent low-income students also received over half of the total funds ($447 million) despite having submitted fewer than half of the applications (475). Districts that do not fall into any of those categories submitted more than half of the applications (964) and were approved for $246 million.
As with any federal program, there were initial concerns that the largest school districts would have a disproportionate advantage in applying for ECF funding, because they have more resources to prepare and submit the application. And in fact, larger school districts—those in the 75th percentile of statewide enrollment (more than 6,270 students) were over-represented in submissions. Large districts submitted 797 applications and were approved for a total of $747 million. By contrast, the smallest school districts—those in the 25th percentile (fewer than 380 students) submitted just 135 applications and were approved for $3.5 million—a miniscule proportion of the total. Urban districts submitted 515 of those applications and received $558 million, while rural districts turned in 355 applications and received $22 million.
Historically underserved districts secured a majority of the ECF money awarded in California
SOURCES: Authors’ calculations using ECF data, 2021–22; CDE data, 2021–22.
NOTES: There were 465 fully identifiable unique applicant districts common to these two data sources. High-EL districts are those with at least 25 percent English Learner students. The threshold is 75 percent for districts with high concentrations of Black or Latino students, or those with high shares of low-income students (those eligible for free or reduced-price meals). In each case, this designation corresponds roughly to being in the 75th percentile of that category. High-EL, high-Black/Latino, and low-income districts sometimes overlap. “Other” districts are those that do not fall into any of these three categories.
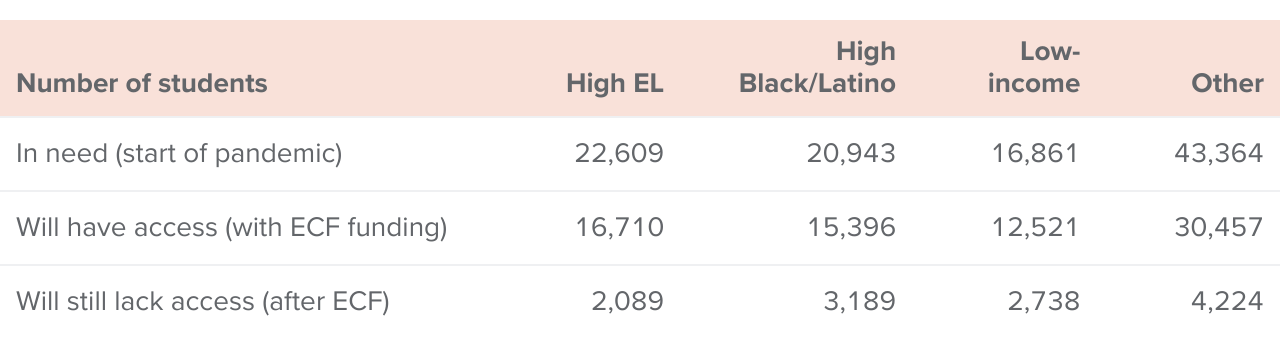
For a more local estimate of the beneficiaries, we rely on information solicited during the application process. Applicant districts responded to inquiries about the number of their students needing connectivity or devices, and how many of those students the district expected to serve using the requested ECF money. Bearing in mind the challenges that districts may have had in accurately estimating existing unmet need at the outset of the pandemic—and indeed, the prospects for meeting that need with then-unrealized funding efforts—we see some consistency between types of districts in their responses (Table 2).
ECF funding unlikely to meet all of students’ needs for both connectivity and devices
SOURCES: Authors’ calculations using ECF data, 2021–22; CDE data, 2021–22.
NOTES: There were 465 fully identifiable unique applicant districts common to these two data sources. High-EL districts are those with at least 25 percent English Learner students. The threshold is 75 percent for districts with high concentrations of Black or Latino students, or those with high shares of low-income students (those eligible for free or reduced-price meals). In each case, this designation corresponds roughly to being in the 75th percentile of that category. High-EL, high-Black/Latino, and low-income districts sometimes overlap. “Other” districts are those that do not fall into any of these three categories.
All three types of underserved districts responded that they expected to be able to meet about 74 percent of the estimated need using ECF dollars. Other districts believed they would meet 70 percent of that need, on average. High-EL districts estimated that 9 percent of their students would still lack access even with ECF funding. That percentage was 15 and 16 percent for high-Black/Latino and low-income districts, respectively. Districts that weren’t characterized by any of those populations estimated that 10 percent of their students would still lack full digital access.
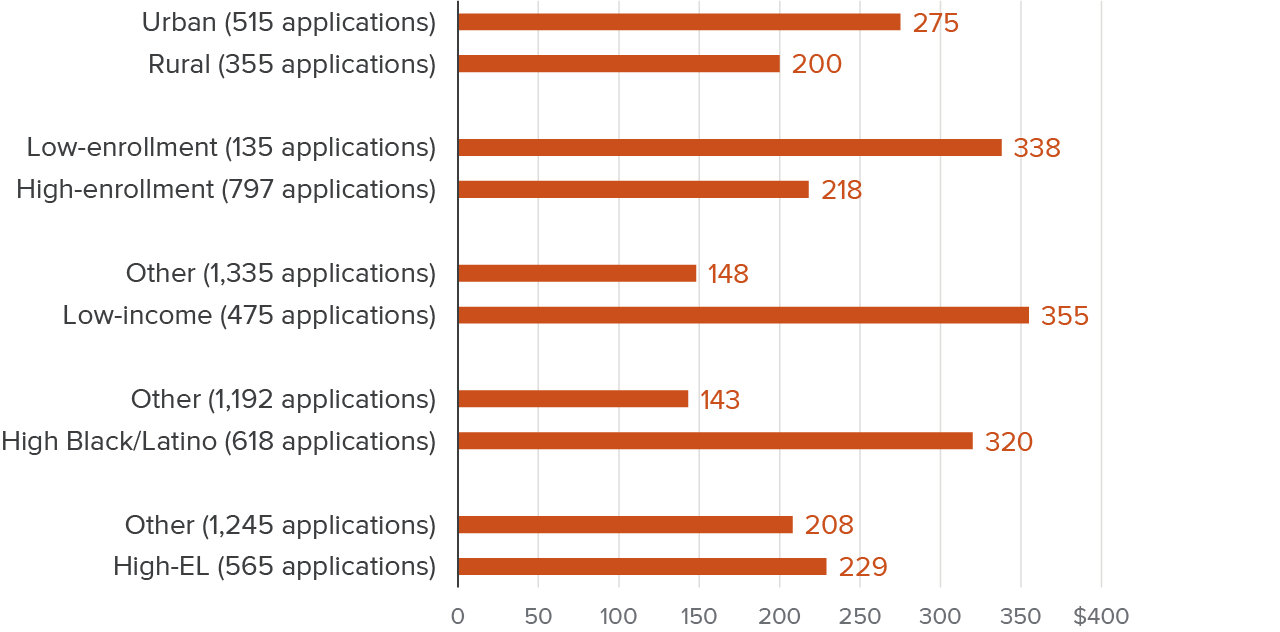
Evaluated on a per-student basis, historically underserved districts also fared comparatively well in securing ECF funding. High-EL districts garnered slightly more money per student ($229) than districts with fewer ELs ($208). That contrast is even more evident when comparing high-Black/Latino and low-income districts with their respective counterparts (Figure 7).
Historically underserved districts were awarded higher levels of per-student funding
Per-student approved amount ($)
SOURCES: Authors’ calculations using ECF data, 2021–22; CDE data, 2021–22.
Despite their evident advantage in submitting applications and getting funding approved, the largest districts (in terms of enrollment) saw lower amounts of funding per student ($218) than did the smallest districts ($338). Urban districts also garnered a higher per-student sum ($275) than did rural districts ($200), but this difference was not substantial.
Although we restrict this analysis to the district level, individual schools, libraries, and regional consortia also applied for and received ECF funding. That said, districts submitted the majority of California’s applications and secured 92 percent of the approved funding (Technical Appendix Table A1).
For context, it is important to keep in mind the considerable diversity within districts. There are ELs, Black/Latino students, and low-income students in all districts, and many examples of individual schools with high proportions of these students within a district, even if the overall concentration at the district isn’t high. Districts we don’t categorize here as underserved contain 36 percent of the state’s ELs, 45 percent of Black students, 39 percent of Latino students, and 38 percent of low-income students.
FCC rules stipulate that ECF beneficiaries may use the funds for connected devices—laptop computers and tablets—that can support remote learning. Smartphones and desktop computers are specifically excluded. Districts can also use the funds for purchasing subscriptions to commercially available broadband service for their students and staff for off-campus use. The purchase of equipment designated for connecting to the internet—such as modems, routers, or Wi-Fi hotspots—is also specifically allowed.
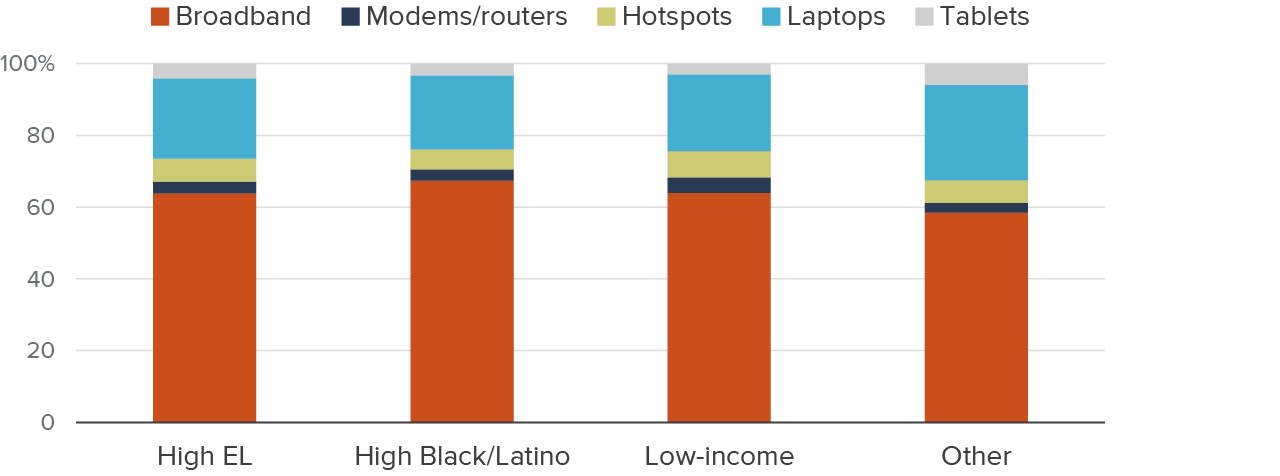
Districts’ applications favored connectivity-related purchases across the board, but this was especially true of high-need districts (Figure 8). High-EL districts specified either connectivity services or connectivity-related equipment in about three-quarters of the applications where the intent could be determined unequivocally. Applications from high-Black/Latino and low-income districts showed similar rates of specifying connectivity, although the shares of its constituent elements (broadband services vs. connectivity-related equipment) varied somewhat. Districts without high shares of those student populations applied for connectivity about two-thirds of the time. Twenty-seven percent of identifiable applications from these districts specified purchase of laptops, and 6 percent requested money for tablets, slightly higher than for each of the high-need types of districts (21% and 3%, on average).
Connectivity purchases dominated ECF applications from school districts of all kinds
SOURCES: Authors’ calculations using ECF data, 2021–22; CDE data, 2021–22.
NOTES: An additional category of expense—“taxes and reasonable charges”—is ambiguous, as those terms can apply to either devices or connectivity, and we have excluded it from this chart. When included in the total, the category comprises roughly a quarter of the applications across each type of district.
Conclusion
School districts serving high percentages of English Learners, Black and Latino students, and low-income students promptly responded to the funding opportunity that emerged in 2021 as the Emergency Connectivity Fund. They were able to secure higher levels of per-student funding than their counterparts, and they focused on services and equipment dedicated to expanding internet access more than purchasing devices.
It may be too early to gauge the ECF’s full effects—although the last application window closed in May 2022, districts that applied then still have until June 2024 to complete their purchases of goods and services. If there is a connection between ECF and closing the digital divide at districts, it could be at least another year before student outcomes might reflect these efforts. However, the impressive response from districts serving high-needs students—as well as their success in securing substantial levels of per-student funding—are encouraging early indicators of its potential to reach its target audience. Nevertheless, responses from applicants as to how well ECF would meet student needs showed that many will still lack connectivity and/or devices.
Now that ECF is winding down, it is time to look ahead. How will districts fill the gaps left by ECF, and how can California make headway in improving digital literacy for high-needs communities?
Several other federal and state programs continue to provide funding for improving internet connectivity for students and their families. The FCC’s Digital Opportunity Fund, the Treasury’s Coronavirus Capital Projects Fund, and the BEAD Program are together slated to provide more than $60 billion over the next several years from the federal side. Closer to home, California’s SB 156 emphasizes connecting historically high-needs communities throughout the state. These ongoing programs could learn from ECF’s outreach efforts, which successfully garnered the interest of school districts that could benefit the most. In contrast to other federal programs whose low take-up rates have left resources unused, ECF applicants eventually exhausted the fund.
In retrospect, however, ECF’s process of approving and disbursing the funds could have been considerably streamlined. Its application and approval process followed the E-rate program model, which has been criticized for being overly cumbersome. By the time ECF funds are fully spent, COVID-19 will be well into its fifth year. The FCC’s telehealth program would be an instructive model for any subsequent program. Although more limited in scope, it allocated $200 million within the first several months of the pandemic.
Going forward, digital literacy will also be a crucial element for ensuring positive outcomes. Providing culturally and linguistically competent support for EL, Black/Latino, and low-income students and their families is particularly important. As distance from the pandemic-induced shutdowns increases, it is well worth further evaluating these methods of establishing and maintaining effective communication with families.
It is laudable that the Emergency Connectivity Fund was able to provide resources to school districts, counties, library systems, and regional consortia to help their constituents gain access to the internet. But the digital divide has plagued California—and the nation—at least since personal computing began to be affordable at the household level. With a wealth of federal and state resources dedicated to increasing access to what is now an essential element of daily life for students and their families, the focus now properly belongs on targeting them towards the people who need them the most.
Topics
K–12 Education