College and career readiness are defined broadly.
- California’s College and Career Indicator (CCI) uses a range of metrics to identify graduating students as college and career ready, including test scores on the statewide Smarter Balanced assessments (SBAC) and completion of the set of “A–G” courses required for admission to the UC and CSU.
- Students who earn college credits through dual enrollment, Advanced Placement (AP), or International Baccalaureate (IB) courses—and those who earn the State Seal of Biliteracy—are also designated as college ready.
- Metrics for career readiness include success in career technical education (CTE) pathways, military leadership courses, apprenticeships, and other job programs.
- As measured by these metrics, 52% of California high school graduates are prepared for college or career, while another 14% are “approaching prepared.”
About one in five students meet statewide test standards for college readiness.
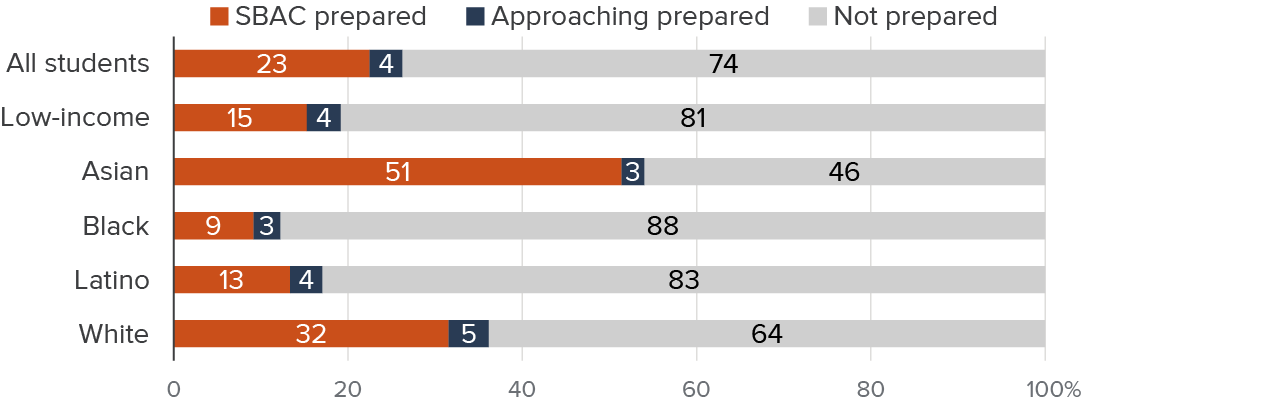
- Students who score “standard met” in both reading and math on the SBAC grade 11 exams are defined by the CCI as academically prepared for college. In 2025, only 23% of California graduates were rated academically prepared. Proficiency rates in English (56%) were twice as high as rates in math (28%).
- Performance on the grade 11 SBAC tests improved each year from 2015 to 2019. But proficiency rates fell sharply during the pandemic and have yet to recover; the 2025 share of college-ready students is 2 percentage points lower than it was in 2019.
- Readiness varies across student groups. About 15% of low-income students are college ready, compared to 31% of students who are not low income. Looking at race and ethnicity, 51% of Asian and 32% of white students are college ready, while rates are 13% for Latino students and 9% for Black students.
As measured by test scores, college readiness varies widely across income and race
SOURCE: California Department of Education: College and Career Indicator.
NOTES: “SBAC Prepared” indicates a student scored at least “standard met” on both the English language arts and the math portion of the grade 11 Smarter Balanced (SBAC) assessments. “Approaching Prepared” indicates a student scored “standard nearly met” on both exams. “Not Prepared” indicates a student scored “standard not met” on one or both exams.
Trends in college preparatory course-taking show promise.
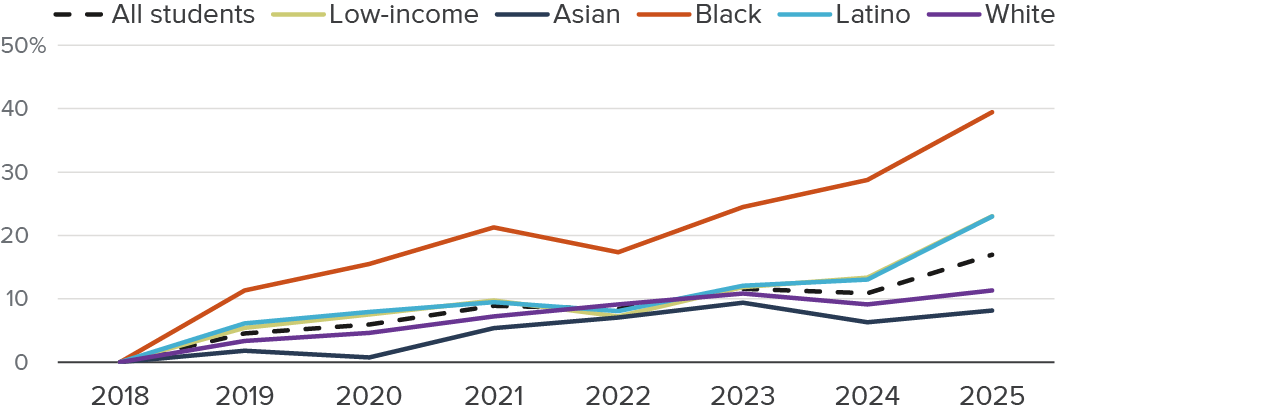
- Nearly half (47%) of high school graduates complete the A–G sequence, a specified number of courses across various subjects required for admission to the UC and CSU. Rates have risen every year since 2018, as more districts have increased access to the courses.
- Asian students have the highest A–G completion rates at 71%. Just over half of white students (52%) complete the A–G courses, as do 41% of Latino students and just over a third of Black students (37%). About 40% of low-income students complete the sequence. Since 2018, A–G completion rates have increased the most for Black and Latino students.
- One-third of high school students participate in dual enrollment courses, but only 12% of these students are college ready according to the CCI, which requires a year of coursework.
- The share of students rated college ready through AP rose from 16% in 2024 to 29% in 2025. This increase, however, is largely due to a change in the CCI criteria: students no longer need to pass two year-end AP exams and can instead earn the distinction with grades of C- or better in any two courses.
Higher shares of Black, Latino, and low-income students are completing courses needed for admission to UC and CSU
Change in A–G completion
SOURCE: California Department of Education: College and Career Indicator.
NOTES: The A–G completion rate is the share of students that complete the A–G course sequence—a set of 15 year-long classes across various subjects required for admission to UC or CSU. The graph shows the percentage change in completion rates relative to 2018.
Strong high school graduation rates may not reflect widespread college readiness.
- High school graduation rates are quite high: 87% of students graduated within four years in 2025. But California’s minimum graduation requirements are lower than most states, and both UC and CSU require additional years of coursework for admission.
- Some districts have adopted more ambitious graduation requirements in order to boost college readiness. A 2017 survey found that half of districts used the A–G course sequence as their graduation standard.
Demand for college is high, but preparing students requires collaboration.
- A college education is typically a good investment that can lead to higher wages. Over 70% of parents hope their children earn a four-year degree, according to the PPIC Statewide Survey; one in six parents say preparing students for college is the most important role of K–12 schools.
- Coordination between the state’s K–12 districts and higher education systems can help students move from high school to college. The new Golden State Pathways Program aims to improve college and career outcomes, with most participating districts planning to expand or enhance dual enrollment.
Topics
Access Equity Higher Education K–12 Education