Table of Contents
- Key Takeaways
- Introduction
- Incarceration and Enforcement after Prop 47 and the Pandemic
- Differences in Crime Trends between California and the US
- Do Changes to Incarceration and Enforcement Shift Crime?
- Conclusion and Recommendations
- Notes and References
- Authors and Acknowledgments
- PPIC Board of Directors
- Copyright
Key Takeaways
Since a 2009 federal court order to reduce prison overcrowding, California has been at the forefront of reforms aimed at reducing incarceration. One critical reform, Proposition 47—passed by voters in 2014— continues to be at the center of policy discussions. Under Prop 47, prison and jail populations plummeted as did arrests for drug and property crimes after certain offenses were reclassified from felonies to misdemeanors. Furthermore, lower prison populations and expenditures have led to $800 million so far in savings that provided funding for treatment and diversion programs. But Prop 47 may not be the most important change to the criminal justice system in recent years; the pandemic brought challenges that have had lasting impacts on incarceration and enforcement.
- Driven by larcenies, property crime jumped after Prop 47 compared to the nation and comparison states; with no further deviations until 2021, partly driven by commercial burglaries. Violent crime also diverged over the last decade, with the sharpest deviation at the start of the pandemic.
- Two years after Prop 47, California’s clearance rate—or reported crimes that lead to an arrest and referral to prosecution—for property crime dropped 3 percent. It then dropped to 7 percent in 2022, signaling that a person is half as likely to be apprehended for property crime today, compared to 2014. The clearance rate for violent crime has remained relatively stable for two decades.
- Jail and prison populations have dropped by a total of 30 percent, but the impact on crime has been modest and limited. With Prop 47, only a rise in auto thefts (3.9%) and car break-ins (3.7%) is tied to lower incarceration; with the pandemic, it was a rise in auto thefts (1.6%) and commercial burglaries (2.1%).
- After Prop 47, lower clearance rates for larceny (theft without force or threat of force) led to a modest rise in property crime, with more burglaries (2.9%), auto thefts (1.7%), and larcenies (1.1%). After the pandemic, lower larceny clearance rates led to a rise in car accessory thefts (7.3%) and car break-ins (3.9%); burglary clearance rates also dropped, raising commercial burglaries (3.2%).
- No evidence suggests that changes in drug arrests after Prop 47 or after the pandemic led to any increases in crime. Due to data limitations, we were not able to assess whether Prop 47 or the pandemic led to any changes in substance use and addiction.
- Focusing on retail theft, fewer cleared property crimes after both Prop 47 and the pandemic led to a rise in commercial burglaries; a drop in the jail population post-pandemic is also tied to a rise in commercial burglaries. Evidence is clearer that retail theft increased due to pandemic responses by the criminal justice system, and the increases were of greater magnitude than increases due to Prop 47.
This report builds on our previous research and is the culmination of a year-long effort to examine the impact of Proposition 47 as the reform approaches its 10th anniversary, as well as the impact of the pandemic-related criminal justice responses; it is not an analysis of recently enacted or proposed legislation or upcoming ballot initiatives such as Proposition 36.
Determining the factors that can reverse falling rates for cleared property crimes—and in turn raise the likelihood of being apprehended—should be a top priority for California’s policymakers. Legislators also should seek evidence-based alternatives to incarceration, which shows limited success with preventing crime. Understanding these factors and alternatives is vital to developing criminal justice policies, especially as research consistently finds that increasing the likelihood of being apprehended is a more effective strategy for preventing crime than harsher penalties or longer sentences.
Introduction
Some crimes in California have increased in recent years, spurring greater concerns about crime even though both violent and property crime rates are well below the rates of the 1980s and 1990s. While the state’s violent crime rate has been ticking up over the last decade and diverging from the nationwide trend, and auto thefts and thefts of car accessories like catalytic converters have jumped in recent years, the rise in retail theft is the focus of current criminal justice policy discussions, which center around concerns that Proposition 47 contributed to the increase.
Since a 2009 federal court’s order to reduce overcrowding in its state prisons, upheld by the US Supreme Court in 2011 (Brown v. Plata), California has been at the forefront of criminal justice reforms aimed at reducing incarceration. Both the legislature and voters have passed reforms that have transformed the criminal justice landscape over the last 15 years, including one of the most significant reforms, Proposition 47.
Proposition 47, passed and implemented almost a decade ago, reclassified a number of drug and property offenses (with theft value $950 or less) from felonies to misdemeanors and created a specific misdemeanor shoplifting category in California’s penal code (PC 459.5). The ballot initiative went into effect immediately after it passed by a wide margin (close to 60% voted yes) in November 2014. The reform also directed savings from the reduced state prison expenses to fund diversion programs—mental health and drug abuse treatment—as part of efforts to address prison overcrowding and more broadly increase the use of alternatives to incarceration. In addition, it provided funding for victim services grants as well as funding aimed at reducing truancy and drop-outs in K–12.
Currently, several efforts look to revise the law in order to address rising retail theft and take aim at drug offenses. A group of recently enacted or proposed legislation as well as a ballot initiative (Proposition 36), seek to increase penalties for some property and drug offenses by allowing prosecutors to charge these offenses as felonies. Such circumstances include aggregating the value of stolen merchandise across incidents, repeat offenders, and possession of hard drugs like fentanyl. Whether any of these efforts would achieve their goals depends on the contributing factors behind increases in some crime. This report is not an analysis of upcoming legislative proposals or of ballot initiatives such as Proposition 36; the report reflects findings on the impact of Proposition 47 in light of its 10-year anniversary, as well as the broad and deep impacts of the public health responses in the criminal justice system to the COVID-19 pandemic.
PPIC has been examining the impact of Prop 47 on crime and aspects of criminal justice since soon after California implemented the reform. One of our prior research reports found evidence that Prop 47 led to an increase in some property crime (larceny). But existing research does not shed light on the specific changes associated with Prop 47 that might have contributed to this increase in larceny, or other crimes. In this report, we build on the existing work on Prop 47 and crime by examining whether the Prop 47 reductions in jail and prison populations, property crime clearance rates—the share of reported crimes that lead to arrest and referral for prosecution, which also can be viewed as a measure of the likelihood of apprehension—and drug arrests are associated with changes in crime. Moreover, as the public health responses to COVID-19 led to further decreases in incarceration and enforcement that are still evident today, and often of greater magnitude than those in the wake of Prop 47, we also assess whether those responses had any impacts on crime rates. The latter is essential for understanding possible contributing factors to increases in retail theft, as most of those increases begin during the pandemic.
Incarceration and Enforcement after Prop 47 and the Pandemic
Determining the direct effects of Prop 47 is fundamental to assessing and understanding its impacts and possible links to public safety. Furthermore, the pandemic brought challenges to criminal justice systems with lasting impacts on incarceration and enforcement that might also affect public safety. We examine how these two events have impacted jail and prison populations, drug and property arrests, and clearance rates for property crimes in California.
Incarceration in California Plunged
A key objective of Prop 47 was to reduce incarceration in the state—and shift resources towards alternative public safety strategies; a look at the county jail and state prison population shows that the reform succeeded in this respect. But the state’s response to the COVID-19 pandemic lowered the incarcerated population more than either Prop 47 or any other significant criminal justice reform over the last decades.
Proposition 47 was part of California’s string of significant criminal justice reforms in the wake of a 2009 federal court order to reduce the state’s institutional prison population to 137.5 percent of design capacity—at the time equivalent to a reduction of almost 40,000 prisoners. The court order meant to address severe overcrowding and unconstitutionally poor prison conditions, including inadequate medical and mental health care.
The state’s first significant reform, realignment (AB 109) in October 2011, shifted correctional responsibilities of most felons convicted of non-serious, non-violent, and non-sexual crimes from the state’s prison and parole system to county jails and probation departments (Figure 1), quickly reducing the state’s prison population by about 27,000 in its first year. However, the state was still about 3,000 inmates above the federal mandate in October 2014. Two years after Prop 47 passed, the prison population had decreased by another 7,000, enough to put it below the mandate of 137.5 percent of design capacity.
While the county jail population increased as a result of realignment—by about 10,000 inmates between September 2011 and October 2014—Prop 47 led to a fast decrease. The jail population dropped by almost 10,000 in the first few months after Prop 47 passed. It started to tick up after that, and by late 2016, the jail population was down about 6,300 compared to before Prop 47.
Criminal justice reforms and the COVID pandemic reduced incarceration in California

SOURCES: California Department of Rehabilitation and Corrections (CDCR) monthly population reports and Board of State and Community Corrections (BSCC), Jail Profile Survey.
Realignment dropped the state’s incarceration rate by 8.5 percent. Two years after Prop 47, the incarceration rate fell further, by almost 8 percent. In the five years between September 2011 and September 2016, jail and prison populations combined dropped by 29,000 inmates.
While these changes have been substantial, the public health responses to COVID-19 led to an even greater drop in the jail and prison populations. In the four years between September 2019 and September 2023 (the most recent date of data), the prison population dropped by almost 30,000 inmates and the jail population by almost 15,000. Compared to September 2011, the incarceration rate has dropped by 36 percent as of September 2023.
California’s decrease in incarceration stands out compared to nationwide trends, especially in the first two decades of the 21st century. In 2000, the state’s incarceration rate was 7 percent higher than the US rate (excluding California); by 2010, it was 7 percent lower (see Technical Appendix Figure A1). Realignment in 2011 increased the gap to 15 percent lower. Then in the year after Prop 47, the state had a 20 percent lower incarceration rate. Since the pandemic, California’s drop in incarceration has also been larger than that nationwide, and by 2022 (the latest year of nationwide statistics), the state incarceration rate was 23 percent lower than the nationwide rate.
Enforcement of Property and Drug Offenses Dropped
The number of arrests in California have tumbled over the past few decades for many reasons, including falling crime rates. In 2022, arrests had fallen to 781,000 from a peak of close to 2 million in 1989. California’s criminal justice reforms contributed, especially Prop 47, as did the response by the criminal justice system to the COVID-19 pandemic (Lofstrom et al. 2019; Lofstrom, Martin, and Raphael 2020; and Premkumar et al. 2023). Clearance rates, especially for property crimes, have also changed notably over the last decade.
Arrest rates declined
After Prop 47, arrests for drug and property offenses fell quickly. In 2013, the year before Prop 47, law enforcement officers made close to 300,000 arrests for drug offenses—roughly 200,000 felony arrests and 100,000 misdemeanor arrests. By 2015, this number had dropped by about 10 percent, to around 270,000, but the composition was reversed, and about a third of arrests were for felonies and two thirds for misdemeanor drug offenses.
Arrests for property offenses dropped by about 11 percent between 2013 and 2015, but the change in composition was much smaller (Figure 2). Felonies declined as a share of arrests for property offenses but remained a majority—falling from 65 percent to 55 percent.
Prop 47 brought immediate and big changes to arrests for drug and property offenses
Annual number of arrests

SOURCE: California Department of Justice’s (CADOJ) Automated Criminal History System (ACHS).
During the pandemic, arrests for both felony and misdemeanor drug and property offenses fell, with misdemeanors plunging by more than 50 percent in the first few months (Figure 3). After that, misdemeanor arrests rebounded but stayed well below the pre-pandemic period, down by almost 40 percent the last quarter of 2022 compared to the last quarter of 2019.
Felony arrests for drug and property offenses also fell at the start of the pandemic in 2020, rose again fairly quickly, but then stayed relatively flat in 2021 and 2022. Still, felony arrests for drug and property crimes are down as of the last quarter of 2022, by 21 percent and 8 percent, respectively.
Felony and misdemeanor arrests for property and drug offenses all fell at the start of the pandemic
Monthly number of arrests

SOURCE: California Department of Justice’s (CADOJ) Automated Criminal History System (ACHS).
Clearance Rates for Property Crime Declined
A higher likelihood of being apprehended for a crime deters people from committing a crime more strongly than the likelihood of receiving a long sentence, according to a robust body of research literature (see for example Apel and Nagin (2016) and NIJ (2016)). That is, the possibility of getting caught deters people more than a harsh punishment.
Here we examine one measure of the likelihood of apprehension for property crimes, and how this measure changed in the wake of both Prop 47 and the COVID pandemic. The measure used here is the clearance rate, which is defined as the share of reported crimes for which police make an arrest and refer the arrestee to prosecution. In other words, clearance rates also reflect the number of crimes that are considered solved.
A number of factors can affect clearance rates, including the difficulty in identifying suspects, the number of reported crimes, the number of law enforcement officers, and priorities within an agency based on severity of the crime. For example, historically, clearance rates for violent crimes are higher than those for property crimes.
While the clearance rate for violent crime has fluctuated, it has stayed relatively constant at around 45 percent between 2010 and 2021; it then dropped to around 40 percent in 2022 (Figure 4). The violent crime clearance rate was somewhat higher in the wake of Prop 47 compared to the years before.
The clearance rate for property crime is much lower than for violent crime and stayed fairly flat around 13–14 percent the decade before Prop 47. It dropped to 11 percent two years after Prop 47; it then fell further during the pandemic to 7 percent in 2022. California’s decrease in the property crime clearance rate stands out compared to nationwide trends as well as against a combination of states that had similar clearance rates prior to Prop 47 (Technical Appendix Figure A3), consistent with Prop 47 being a factor in reducing California’s clearance rate.
The clearance rate for property crimes dropped in the wake of Prop 47 and the pandemic

SOURCE: California Department of Justice (CADOJ) Crimes and Clearances file.
NOTE: The clearance rate is the share of reported crimes for which police make an arrest and refer the arrestee to prosecution.
While the annual number of cleared violent crimes rose from 69,000 in 2013 to 78,000 in 2016, the number for cleared property crimes dropped from 137,000 to 115,000. This difference may partly reflect a shift of priorities to violent crimes in the wake of Prop 47. By 2022, cleared violent crimes increased slightly, to roughly 79,000 crimes that were considered solved—showing the clearance rate for violent crimes fell during the pandemic due to a rise in reported violent crimes. Cleared property crimes dropped further during the pandemic, to 65,000 in 2022.
Fewer cleared larcenies mostly drove the lower clearance rates for property crimes—cleared larcenies dropped from 16 percent in 2014 to 11 percent in 2017 (see Technical Appendix Figure A2). Cleared burglaries also fell from 14 percent to 11 percent over the same period. Both rates declined further during the pandemic, cleared larcenies to slightly above 6 percent and cleared burglaries to 7 percent.
These decreases in solved crimes clearly indicate that the likelihood of apprehension for committing these crimes has also fallen. That is, using the clearance rate as our measure, the likelihood someone will be arrested after committing a larceny dropped by about 32 percent in the wake of Prop 47, and then by another 38 percent between 2019 and 2022, during the pandemic.
Reduced staffing may have led to lower clearance rates
The stark decline in the state’s law enforcement staffing may be a contributing factor to California’s falling clearance rates for property crime (Lofstrom, Martin, and Skelton 2023). The decline started, and was greatest, around the Great Recession, when the sworn officer’s rate dropped 10 percent (Technical Appendix Figure A5). For a few years, the rate was steady until it fell again in both 2021 and 2022, when the state saw a decrease of 3,600 sworn officers.
In contrast, the rest of the nation’s sworn officer rate in recent years is roughly where it has been over the last two decades (Technical Appendix Figure A5). The decrease was less noticeable in the wake of the Great Recession; it started to rise in 2015 and reached pre-Great Recession levels again by 2021.
To gauge to what extent staffing declines drive California’s declines in property crime clearance rates, we analyze annual data for the number of sworn officers in each county to examine whether counties with bigger changes in staffing also had bigger changes in clearance rates.
With fewer sworn officers, fewer crimes could be cleared, according to our estimates. Between 2008 and 2022, the number of officers fell to 27 officers per 100,000 residents, which our estimates suggest resulted in a 1 percentage point drop in the property crime clearance rate and 1.4 percentage point drop in the violent crime clearance rate.
Enforcement strategies and priorities changed
The Prop 47 reclassification of some property and drug offenses from felonies to misdemeanors sent a signal that the criminal justice system should view drug and property offenses as less serious offenses, requiring different responses than before. Similar signals were sent during the pandemic, although this time initiated by public health concerns. State and local directives aimed at reducing the spread of the coronavirus included reducing interactions between law enforcement officers and the public and minimizing the flow of individuals in and out of jails, prisons, and courtrooms to decrease the inmate populations and reduce overcrowding.
Decisions by police officers plausibly reflect all of these factors; how to respond to a call for service, investigations, and whether to arrest and book a suspect of a property crime all represent decisions about how to allocate limited resources, including their time and energy. The decrease in law enforcement officers in California also may have exacerbated these factors and further required prioritizing more serious offenses.
Changes in clearance rates varied across counties
Rates for solved crimes vary across the state—and after Prop 47 and the pandemic, clearance rates for property crime differed greatly across counties. Figure 5 shows annual cleared larcenies for the 15 most populous counties, before and after Prop 47 and the pandemic (see Technical Appendix Table A1 for all counties). We see, for example, that San Bernardino had one of the highest rates for cleared larcenies (20%) before Prop 47 but it dropped afterward (to 12%). In Fresno, the rate fell only slightly from 17 percent to 16.7 percent. In Contra Costa, cleared larcenies inched up from 9.6 percent to 9.9 percent while in San Francisco they dropped to 4.9 percent.
Larceny clearance rates fell further for all 15 large counties through the pandemic; but again, the changes differ notably. Fresno’s cleared larceny rate had risen to 19 percent before the pandemic, only to plunge below 7 percent in 2022. Ventura was also around 19 percent before the pandemic; its drop was much smaller than in Fresno, to slightly above 13 percent.
Larceny clearance rates fell after Prop 47 and the pandemic for the 15 largest counties
Larceny clearance rate

SOURCE: California Department of Justice (CADOJ) Crimes and Clearances file.
NOTES: Pre-Prop 47 here refers to November 2013–October 2014 and post-Prop 47 to 2017; pre-COVID refers to March 2019–February 2020 and post-COVID to 2022. The clearance rate is the share of reported crimes for which police make an arrest and refer the arrestee to prosecution.
Changes in jail and prison incarceration rates, as well as drug arrest rates, also varied notably across counties in the wake of Prop 47 and the pandemic (see Technical Appendix Tables A3 and A4). These county-level differences provide an opportunity to examine and test the extent to which clearance rates may impact crime rates, a key part of this report, discussed in more detail below.
Differences in Crime Trends between California and the US
To determine whether California’s crime trends stand out, we examine trends post-Prop 47 and post-pandemic. We compare the state’s trends to nationwide trends (without California) and to groups of comparison states that had similar trends before California embarked on a number of significant reforms in 2011. Post-pandemic comparisons in particular are descriptive only, as all states faced the challenges of COVID. Broadly, the data suggests that California’s violent crime rate deviated most clearly from comparison states and the nation at the beginning of the pandemic. In terms of the deviations around property crime, California saw discrete increases immediately following realignment and Prop 47—driven by auto thefts in 2012 and larceny in 2015. Then the state had no upturn until 2021, which was partly driven by an increase in commercial burglaries, which contributed to a slight increase in burglaries in California when the rest of the nation saw a continued drop.
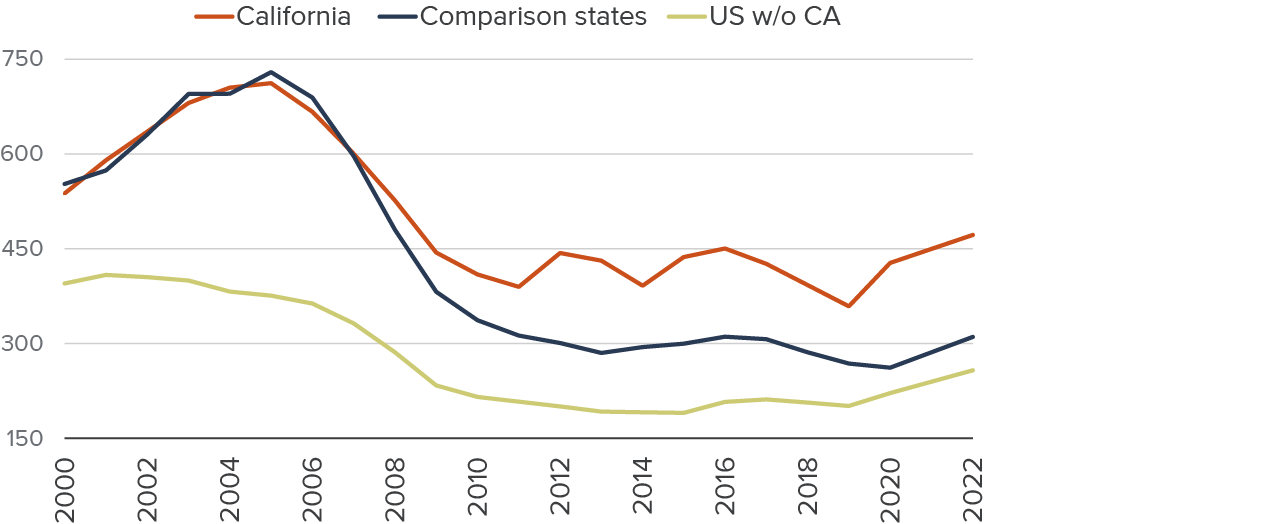
California’s violent crime rate started to increase in 2015, appearing to deviate from comparison states (Figure 6). This rise, however, was primarily driven by underreporting of aggravated assaults (the largest category of violent crimes) by the Los Angeles Police Department (LAPD) before 2014 (Bird et al. 2018). Improved reporting of LAPD violent crime data in 2015 accounts for a large share of the statewide 2014–2015 increase. When LAPD is excluded from the data, California’s violent crime rate mirrors nationwide trends and closely follows that of the comparison states until the post-pandemic years. The recent increase in California is driven by aggravated assaults and robberies (Technical Appendix Figures A6 and A7).
California’s violent crime rate after the pandemic deviates from nationwide and comparison states trends
Violent crime rate

SOURCE: Author estimates based on annual state-level data from the FBI’s Uniform Crime Reports, 2000–2022, excluding 2021 due to unusually low number of reporting law enforcement agencies.
NOTE: Crime rates are defined as the number of reported crimes per 100,000 residents.
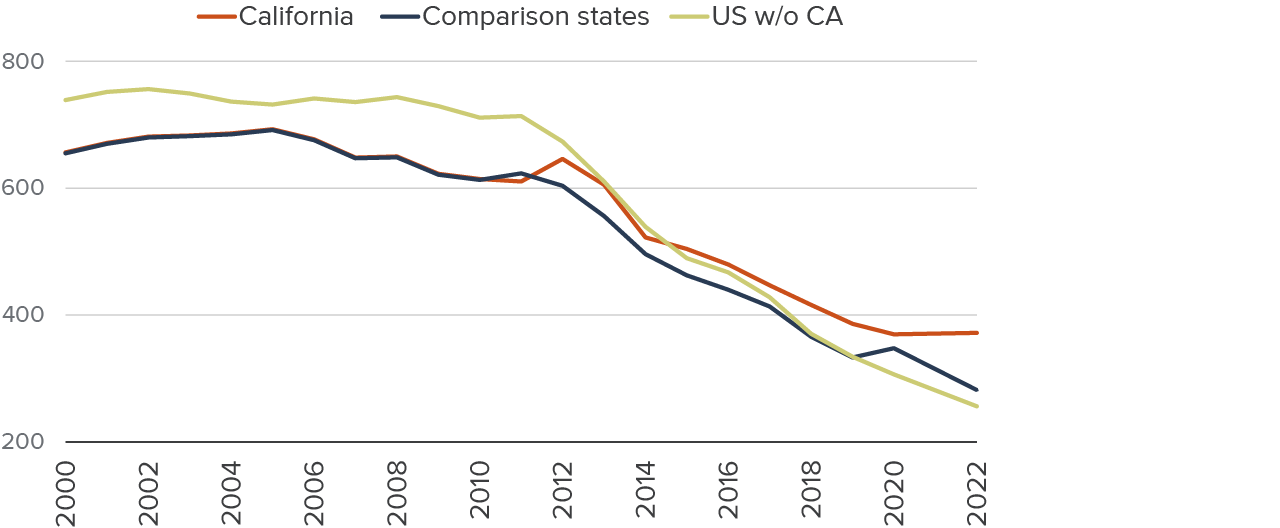
The trend for California’s property crime jumps in 2012, 2015, and 2022 (Figure 7)—the rate started to deviate in 2011 (realignment went into effect October 1 that year) from that of the comparison states and by 2012 it was about 10 percent higher. Property crime rates then paralleled those of comparison states and the nation until 2015, when the gap with the comparison states jumped roughly another 10 percent, enough to land above the nationwide rate. As with realignment, after the initial jump, the gaps did not widen in the immediate following years. However, California’s property crime rate since the pandemic rose further relative to both the nation and comparison states, and in 2022 was higher by 23 percent and 30 percent, respectively. These increases over the last decade are driven by different types of property crimes.
California’s property crime rate jumped in 2012, 2015, and 2022
Property crime rate

SOURCE: Author estimates based on annual state-level data from the FBI’s Uniform Crime Reports, 2000–2022, excluding 2021 due to unusually low number of reporting law enforcement agencies.
NOTE: Crime rates are defined as the number of reported crimes per 100,000 residents.
Auto Theft Rose in California and the Nation
A rise in auto thefts after realignment drove the 2012 jump in California property crime (Lofstrom and Raphael 2013). Auto thefts in California then fell but rose again in 2015, similar to comparison states and the nation. And while California’s post-Prop 47 increase is greater than in comparison states, it was not statistically significant (Bird et al. 2018). The broad and significant jump in auto theft seen across the country since the pandemic is evident in Figure 8; but again, California’s increase is larger than that observed nationwide or in the comparison states.
Auto thefts jumped most after realignment, but also rose in California after Prop 47 and the pandemic
Auto theft rate
SOURCE: Author estimates based on annual state-level data from the FBI’s Uniform Crime Reports, 2000–2022, excluding 2021 due to unusually low number of reporting law enforcement agencies.
NOTE: Crime rates are defined as the number of reported crimes per 100,000 residents.
California experienced another distinct jump in property crimes in 2015, and while auto theft contributed, a rise in larceny after Prop 47 was the primary driver (Bird et al. 2018). The increase in larcenies stands out relative to comparison states and the broader nationwide trend (Figure 9), driven by car break-ins, although a 2015 increase in shoplifting also contributed (Bird et al. 2018). California’s larceny rate inched slightly above that of the nationwide trend in 2019 for the first time since 2000; in 2022 it was about 8 percent higher. The gap between California and the comparison states has stayed relatively constant.
Larceny immediately jumped after Prop 47 passed, and it has stayed higher than comparison states since 2015
Larceny theft rate

SOURCE: Author estimates based on annual state-level data from the FBI’s Uniform Crime Reports, 2000–2022, excluding 2021 due to unusually low number of reporting law enforcement agencies.
NOTE: Crime rates are defined as the number of reported crimes per 100,000 residents.
Burglaries Inched up in California during the Pandemic
Burglaries have been trending down in California since 2005. Year-over-year increases occurred in only two years, 2012 and 2022. While the 46 percent drop is impressive, nationwide and in comparison states, the drop has been even greater, by 65 percent and 59 percent, respectively (Figure 10). The gap widened mostly over the last few years: while the burglary rate stayed roughly flat in the post-pandemic years in California, it continued to fall nationwide and in the comparison states.
Burglaries have been trending down in California over the last decade but the gap to comparison states and nationwide trends increased during the pandemic
Burglary rate
SOURCE: Author estimates based on annual state-level data from the FBI’s Uniform Crime Reports, 2000–2022, excluding 2021 due to unusually low number of reporting law enforcement agencies.
NOTE: Crime rates are defined as the number of reported crimes per 100,000 residents.
Given the string of criminal justice reforms in California and given that all states faced the challenges of the COVID pandemic, the above analysis does not lend itself well to determining reliably statistical significance of deviations of trends. Even when such tests can be credibly performed, they do not identify possible links between changes in criminal justice outcomes (such as incarceration and enforcement) and crime. We next turn to our analysis aimed at addressing both of these shortcomings.
Do Changes to Incarceration and Enforcement Shift Crime?
As intended, Prop 47 reduced incarceration in California. Two years after its implementation, California’s jail and prison population had dropped by about 13,000 and led to an estimated state savings of $800 million (funding a wide range of local-level programming), not including county savings from lower jail populations. The state and counties presumably saw even bigger savings on correctional spending from the large decline in the jail and prison population in the wake of the pandemic. Nevertheless, some crimes may have grown because the reform and the pandemic led to fewer offenders being incarcerated and led to lower enforcement.
It is important to identify the channels through which Prop 47 and the pandemic may have impacted crime in order to address the negative and unintended consequences. Two main channels, or effects, are the incapacitation effect and the deterrent effect.
The incapacitation effect can occur when a policy that lowers incarceration leads to offenders having more “street time,” or time in the community, and therefore more opportunities to commit a crime. That is, crime rates may rise because people are not incarcerated and not prevented from committing crime, which lowers the incapacitation effect.
A deterrent effect may happen when the likelihood of apprehension goes down—that is, offenders feel that they are more likely to get away with committing a crime or seeing no consequences. The sharp drop in property crime clearance rates—or solved property crimes—could be viewed as lowering the chance of apprehension and therefore lowering the deterrent effect.
Enforcement of drug offenses is considered another channel related to crime rates. Fewer drug arrests may contribute to lower incarceration, as captured by drops in jail and prison population. But fewer drug arrests also may mean fewer opportunities for individuals to receive drug use treatment—and some untreated individuals may go on to commit crime, especially property crime, to generate income for drugs.
The changes in enforcement and incarceration as a result of Prop 47, and the public health responses to the pandemic, varied across counties (see Technical Appendix Tables A1–A4)—and varied substantially within and between counties. Therefore, we can assess whether a county’s crime rate changes as incarceration and enforcement changes within that county. We can also assess whether crime rises more in counties that see a greater drop in prison and jail inmates, and that see lower enforcement.
Prop 47 Led to a Rise in Property Crime but not in Violent Crime
The drop in incarceration and larceny clearance rates point to a modest rise in some property crime in the first two years after voter approval. We find no evidence that changes in drug arrests impacted either violent or property crime during the same period. It is worth noting that we are only examining one measure of changes in how the criminal justice system treats drug offenses (arrests) on one set of outcomes (crime rates). Due to data limitations, we were not able to assess whether Prop 47 led to any changes in substance use and addiction.
Property crime rose slightly by a statistically significant 2.1 percent due to the drop in prison incarceration, driven by a 3.9 percent statistically significant rise in auto thefts (Figure 11). The impact Prop 47 had on auto theft due to a lower prison population is smaller as a percentage than realignment’s impact on auto theft (Lofstrom and Raphael 2013). This is because Prop 47 did not reduce the prison population by as much as realignment, and the Prop 47 impact is somewhat smaller. Measured per felon not incarcerated in prison as a result of realignment the impact was 1.2 additional auto thefts per year, while it was 0.7 for Prop 47. Estimates reveal no statistically significant evidence of an impact on violent or property crime rates from the falling county jail populations.
As a result of lower clearance rates for larceny, we estimate that the rate of property crime rose by a statistically significant 1.6 percent. Specifically, larceny went up by 1.1 percent; auto theft by 1.7 percent; and burglaries by 2.7 percent (all statistically significant). Combined with the effect from the decrease in the prison population, this suggests that Prop 47 contributed to roughly one third of the overall increase of close to 25,000 auto thefts in California between 2014 and 2016.
Decreases in larceny clearance rates after Prop 47 had broad but modest impacts on property crime

SOURCES: Author estimates using California Department of Rehabilitation and Corrections (CDCR) population reports and California Department of Justice (CADOJ) Crimes and Clearances file.
NOTES: The estimated impacts are calculated based on the mean change in the exogenous changes in the jail and prison incarceration rates, clearance rates, and drug arrests, relative to the 12-month average crime rate pre-Prop 47. The colored squares represent the estimated impact, and the arrows represent a 95 percent confidence interval. The regression estimates these calculations are based on are shown in Technical Appendix Tables B2–B4.
Looking at car break-ins (a type of larceny) during the first two years after the reform, we find a 3.7 percent statistically significant increase as a result of the drop in the county jail population. During the same period, car break-ins also went up as a result of lower clearance rates, by 2.1 percent (Figure 12).
The rise in burglary appears to stem from both residential and commercial burglaries—but the estimates also suggest that shoplifting decreased by a statistically significant 2.2 percent, as a result of lower larceny clearance. This surprising finding may be due to a change in reporting, as shoplifting was defined as a separate misdemeanor category (limited to theft value of $950 or less) in the state’s penal code as a result of Prop 47. Incidents where the value of thefts is above $950 can be charged as second-degree burglary, and as such, may be contributing to the increase in commercial burglaries. While we were unable to include 2023 crime numbers in our analysis, it is important to note that both shoplifting and commercial burglary were higher in 2023 than before Prop 47; however, our analysis below shows that pandemic policies played a greater role in the increase.
We can see evidence of this shift when commercial burglaries are split into daytime and nighttime incidents. After 15 years of staying within a narrow band of 53–55 percent, the share of daytime burglaries jumped to 60 percent in 2015 and reached 64 percent in 2017 (see Technical Appendix Figure A8). If a shift to reporting more retail theft incidents as commercial burglaries rather than shoplifting (a larceny) explains the rise in commercial burglaries, then the effect of fewer cleared larcenies on both shoplifting and commercial burglary is not statistically different from zero. However, we cannot rule out that the fall in shoplifting incidents in counties where the clearance rate also fell most may reflect retailers’ response—by reporting fewer shoplifting incidents.
Additionally, we see no evidence of differential impacts between the first and second year after Prop 47, using regression models. However, changes in prison incarceration rates on shoplifting may be an exception: we find some weak evidence that in the first year, the Prop 47 prison population drawdown caused a 5.1 percent increase in shoplifting that disappeared by the second year.
More car break-ins after Prop 47 were driven by lower jail populations and larceny clearance rates
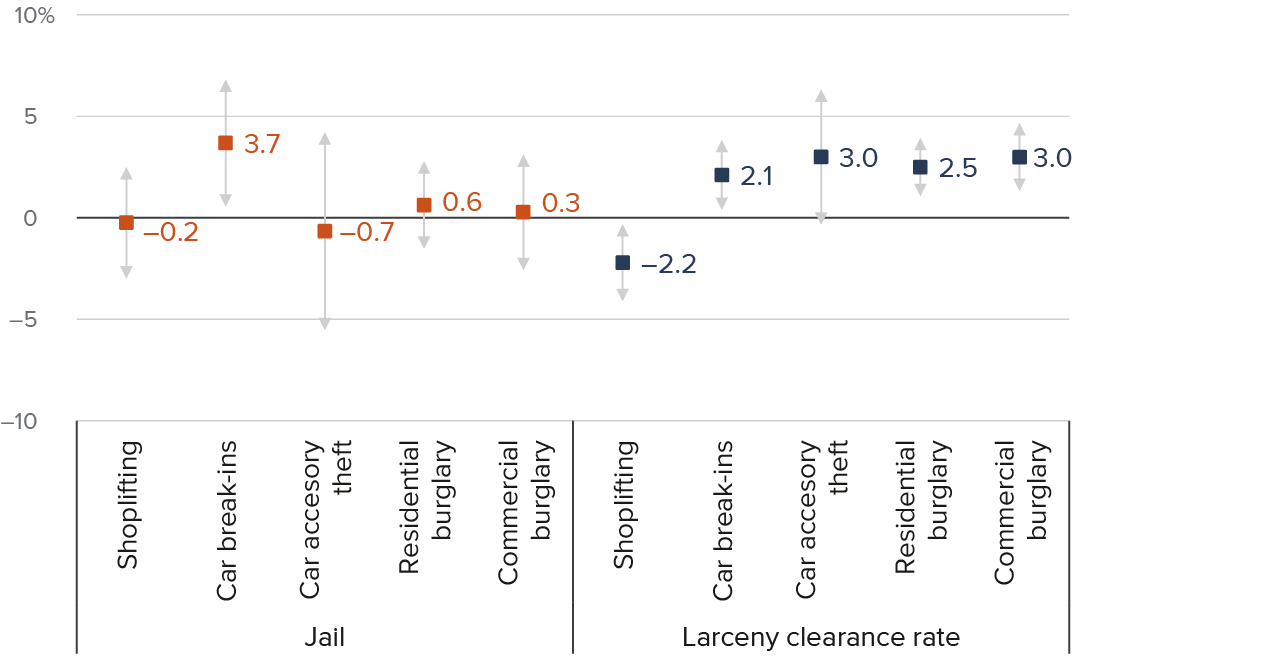
SOURCES: Author estimates using Board of State and Community Corrections (BSCC), Jail Profile Survey and California Department of Justice (CADOJ) Crimes and Clearances file.
NOTES: The estimated impacts are calculated based on the mean change in the exogenous changes in the jail and prison incarceration rates, clearance rates, and drug arrests, relative to the 12-month average crime rate pre-Prop 47. The colored squares represent the estimated impact, and the arrows represent a 95 percent confidence interval. The regression estimates these calculations are based on are shown in Technical Appendix Tables B2–B4.
Lastly, we do not find convincing and strong evidence of an impact of Prop 47 on violent crime (similar to Dominguez et al. 2022). Some findings suggest a slight rise limited to robberies of about 3 percent, due to the Prop 47 drop in the prison population, which may have contributed to the 11 percent increase between 2014 and 2016.
Pandemic Responses Also Led to a Rise in Some Property Crime
While some violent crime has increased in California in the last few years, we find no convincing evidence to connect lower pandemic incarceration and enforcement with those increases. However, the pandemic drawdown in the jail population and drop in cleared property crimes led to moderate increases in property crime. Cars in particular have become targets, and commercial burglary has increased. The lower prison population and fewer drug arrests do not appear to have had any impact on crime.
In counties where jail incarceration rates fell more than others, auto thefts and burglaries rose more, by 1.6 percent and 1.5 percent respectively (Figure 13). The large drop in larceny and burglary clearance rates led to higher larcenies and burglaries, by 2.8 percent and 1.3 percent, respectively.
With lower incarceration and clearance rates during the pandemic, some property crimes had modest increases
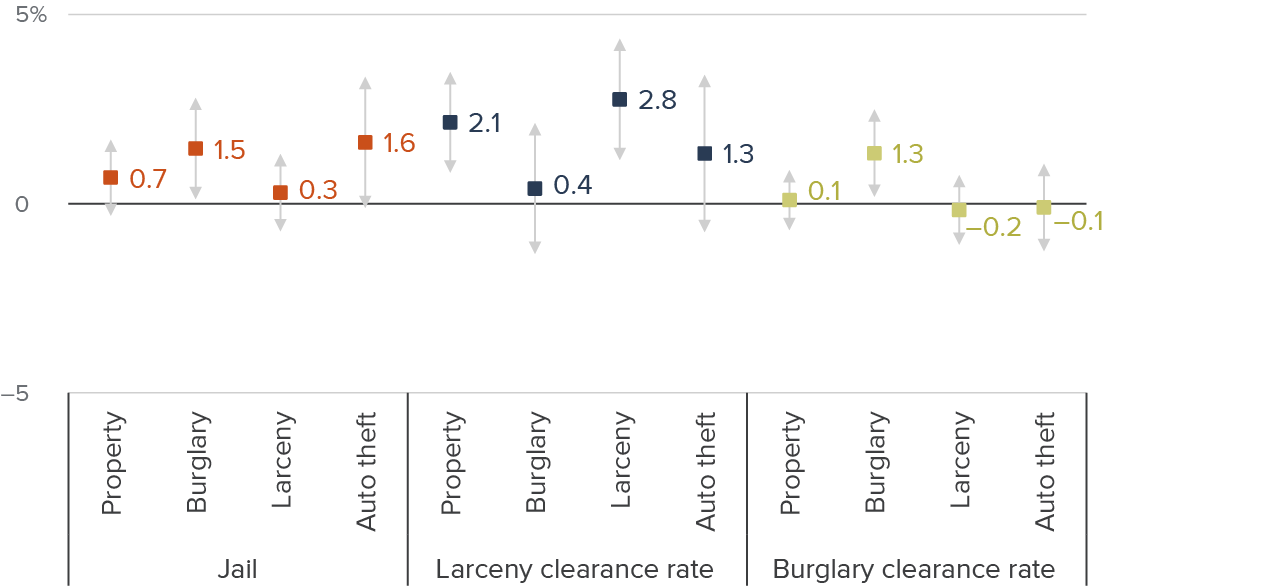
SOURCES: Author estimates using Board of State and Community Corrections (BSCC), Jail Profile Survey and California Department of Justice (CADOJ) Crimes and Clearances file.
NOTES: The estimated impacts are calculated based on the mean change in the exogenous changes in the jail and prison incarceration rates, clearance rates, and drug arrests, relative to the 12-month average crime rate pre-Prop 47. The colored squares represent the estimated impact, and the arrows represent a 95 percent confidence interval.
Commercial burglaries drive the rise in burglaries, up by 2.1 percent due to the drop in jail incarceration and by 3.2 percent due to the drop in the burglary clearance rate (Figure 14). Combined, the roughly 5 percent increase represents slightly less than one third of the statewide 16 percent increase in commercial burglaries between 2019 and 2022.
Theft of car accessories, such as catalytic converters, skyrocketed during the pandemic in California and across the nation, possibly driven by a jump in the price of some precious metals that are parts of catalytic converters. In California, reported incidents of car accessory thefts jumped by 89 percent between 2019 and 2022. While the increase of 7.3 percent due to lower clearance rates stands out in our estimates, it represents only a fraction of the overall increase in car accessory thefts.
While car break-ins statewide fell during the pandemic (by 23%), in counties with relatively bigger drops in cleared larcenies, the drop in car break-ins was smaller, by 3.9 percent, as measured by the average pandemic-caused drop in the larceny clearance rate; that is, in counties that solved fewer larcenies, car break-ins fell less.
Pandemic drops in the jail incarceration and burglary clearance rate led to increases in commercial burglaries

SOURCES: Author estimates using Board of State and Community Corrections (BSCC), Jail Profile Survey and California Department of Justice (CADOJ) Crimes and Clearances file.
NOTES: The estimated impacts are calculated based on the mean change in the exogenous changes in the jail and prison incarceration rates, clearance rates, and drug arrests, relative to the 12-month average crime rate pre-Prop 47. The colored squares represent the estimated impact, and the arrows represent a 95 percent confidence interval.
Conclusion and Recommendations
Growing concerns and headlines about crime have led California to consider rolling back some of its decade of reforms, specifically Proposition 47. This report sheds light on the impacts of Proposition 47 as the reform reaches its 10th anniversary, as well as the broad and deep impacts of the public health responses in the criminal justice system to the COVID-19 pandemic—it does not assess Proposition 36, or recently enacted or proposed legislation.
Potential reversals primarily aim to address a rise in retail theft, but they also address drug offenses; that is, the proposals seek to increase penalties for some property and drug offenses. Whether any of these efforts would achieve their goals depends on the contributing factors behind increases in some crime.
We examined whether certain factors have caused crime to go up: falling jail and prison populations, the lower likelihood of apprehension for property crimes, and fewer arrests for drug offenses. Our analysis looks beyond the years around Prop 47 to outcomes after the public health responses to the COVID pandemic. The latter is important, as the magnitude of the pandemic-induced impacts on incarceration and drug and property offense enforcement were mostly larger than those caused by Prop 47.
We find that lower clearance rates for larceny as a result of Prop 47 led to a modest rise in property crime in the reform’s first two years (clearance rates are the share of reported crimes involving an arrest and referral to prosecution, a measure that can be viewed as the likelihood of apprehension), with increases in theft of car accessories (3%, or roughly 40% of the overall increase of 3,600 thefts) and car break-ins (2.1%, or roughly 12% of the jump of 35,300 car break-ins).
Cars also increasingly became targets when incarceration and enforcement changed in response to the pandemic. Auto theft increased by 1.6 percent when jail populations fell, a fraction of the 32 percent statewide increase of about 41,000 auto thefts between 2019 and 2022. Lower clearance rates for larceny led to a much larger rise (7.3%) in car accessory thefts, like catalytic converters, but also represented only a small share of the overall increase of 89 percent (up by roughly 47,000 incidents). The decline in the larceny clearance rate also affected car break-ins, by 3.9 percent.
Importantly, we find no evidence that changes in drug arrests in the wake of Prop 47 or the pandemic led to any increases in crime.
Factors Contributing to Increases in Retail Theft
Property crimes related to retail theft are currently at the center of policy discussions in California. Our estimates suggest, however, that shoplifting decreased by 2.2 percent during the first two post-Prop 47 years, a surprising finding that may reflect that retailers are less likely to report this crime in jurisdictions with low larceny clearance rates—where reporting an incident may not lead to consequences. Also, as shoplifting is limited to incidents where the value of the stolen merchandise is $950 or less (defined by the state’s penal code as a result of Prop 47), law enforcement may instead report retail theft incidents where stolen merchandise is valued over $950 as commercial burglary, because these incidents can be charged as a felony second-degree burglary. The 3 percent rise in commercial burglaries as a result of Prop 47 drops in larceny clearance rates aligns with this theory, as do the notable and coinciding increase in the share of commercial burglaries that took place in the daytime.
To conclude that lower clearance rates did not affect retail theft, we need to assume that retailers’ reporting of shoplifting was mostly unchanged, even if consequences are increasingly unlikely. While weak evidence points to shoplifting rising (5.1%) after the prison population fell, this change was limited to 2015, the first year after Prop 47. Again, a lower number of actual shoplifting incidents getting reported in later years may be responsible. Unfortunately, given the lack of data that accurately, completely, consistently, and credibly captures retail theft incidents, it is impossible to reliably assess the role of Prop 47 on retail theft.
A stronger and broader impact on retail theft appears after the public health responses to the pandemic, using changes to commercial burglaries as our measure. When jail populations and burglary clearance rates fell, commercial burglaries rose by a combined 5.3 percent, representing roughly one third of the increase observed over that time. Some weak evidence also points to a 2021 rise in commercial burglaries tied to low clearance rates. Unlike Prop 47, we find no evidence of an offsetting impact on reported shoplifting incidents.
Looking beyond Incarceration
We do not find convincing evidence that lower incarceration after Prop 47 had a greater impact on crime (car break-ins being an exception) than realignment (Lofstrom and Raphael 2013). The even greater decreases of 45,000 inmates initiated by the pandemic also do not seem to have had any greater impacts on property crime than realignment or Prop 47 (up by roughly an additional 2,200 auto thefts and 1,600 commercial burglaries). While that is encouraging, we also note that our estimates do point towards some weak (only marginally statistically significant) evidence of impacts from decreases in the jail populations on violent crime (robberies and aggravated assaults) in 2021. Although this is far from strong and convincing evidence of a link between decreases in incarceration and increases in violent crime, the state has seen increases in these types of crimes since the pandemic, and further efforts to determine contributing factors are needed.
Efforts to identify evidence-based alternatives to incarceration, including addressing the continued decrease in law enforcement staffing, should be considered. Police staffing has a strong deterrent effect on crime, especially on violent crime (Chalfin and McCrary 2018). Other strategies that may prove effective include preventive interventions among at-risk youth, people with behavioral and substance use challenges, and other targeted groups. Importantly, efforts funded by the state prison savings may have countered some rise in crime and led to improved outcomes for offenders. Rigorous evaluation of these funded efforts and dissemination of those findings should be elevated and prioritized.
Prioritizing Decisions around Enforcement
Enforcement of property and drug offenses plummeted as a result of both Prop 47 and the pandemic; the likelihood of apprehension for a larceny fell notably as well, which led to moderate but broad increases in property crimes.
The Prop 47 reclassification of some property crimes from felony to misdemeanor may have contributed to lower arrest and clearance rates. For example, with some exceptions—such as so-called citizen arrests—arrests for misdemeanor property crimes like shoplifting have greater requirements than felonies: an arrest requires that the officer was present when a crime took place or has a warrant for the suspect’s arrest issued by a judge. Furthermore, adjusting the severity of some property and drug offenses from felonies to misdemeanors may have influenced the priorities of criminal justice actors such as law enforcement officers, prosecutors, and the courts, as voters signaled that drug and property offenses should be viewed as less serious offenses that require different responses than before.
Similar signals were sent during the pandemic, although this time initiated by public health concerns, as the coronavirus presented serious challenges to criminal justice systems. State and local directives aimed at reducing the spread of COVID included reducing interactions between law enforcement officers and the public, as well as arrests and bookings (Premkumar et al. 2023).
Police officers’ decision and discretion plausibly reflects all of these factors. How to respond to a call for service, which investigations to pursue, and whether to arrest and book a suspect of a property crime all represent decisions on how to allocate limited resources, including time and energy. The decrease in law enforcement officers in California may have further required that more serious offenses receive priority. Disentangling how all of these factors affect law enforcement and their ability to solve cases is a much needed effort for the future.
The Unintended Consequences of Reform
Changes in enforcement and incarceration, whether as a result of Prop 47 or the criminal justice system’s responses to the pandemic, also may have had unintended consequences beyond impacts on crime. While Prop 47 saved the state $800 million on prison expenditures, which funded some substance use treatment, it may have led to lower participation in drug courts. If so, fewer individuals may have received and completed needed treatment for drug addiction. Experts have raised concerns that the incentive for participating and completing treatment through drug courts may have decreased when sentences shortened after some drug and property crimes were reclassified from felonies to misdemeanors; some evidence supports these concerns (Arnold, Benally, and Friedrich 2020). And while incarceration has dropped, the share of the inmate population with mental health needs has increased in county jails (Lofstrom and Martin 2023). Homelessness also may have increased. These are societal impacts that research has not yet examined closely.
Topics
COVID-19 Criminal Justice