
Table of Contents
- Key Takeaways
- Introduction
- The Timeline of Pandemic Changes to CalFresh
- Resources for CalFresh Households during the Pandemic
- Households Boosted Most by Emergency Allotments
- Combining CalFresh and Employment
- Remaining on CalFresh while Eligible
- Conclusion and Recommendations
- Notes and References
- Authors and Acknowledgments
- PPIC Board of Directors
- Copyright
Key Takeaways
Emergency allotments were increases to CalFresh from March 2020 to February 2023 that ensured that every CalFresh household received the maximum amount for their household size. The policy was later revised in April 2021 so that the lowest-income families, who were already eligible for large or maximum benefits, received at least a $95 boost. Examining this pandemic aid and its impact on household resources can offer lessons for crafting a response from CalFresh during the next economic downturn—and for improving the program in the near term.
- CalFresh benefits grew substantially during the pandemic, although inflation eroded their value. The March 2020 emergency allotments were the largest pandemic-era increases to CalFresh, growing benefits by 43 percent on average from February 2020; the April 2021 policy increased benefits by 11 percent from the previous month. While average benefits doubled during the pandemic, after accounting for inflation they increased 77 percent. →
- Unemployment Insurance (UI) benefits temporarily played a major role for CalFresh households. By fall 2020, as many as 27 percent of households that included adults enrolled in CalFresh had income from UI—up from just 2 percent before the pandemic. →
- Each emergency allotment boost impacted different CalFresh households. The first boost focused on households with higher earned incomes or whose main income was from Supplemental Security Income/State Supplementary Payment (SSI/SSP). The second boost assisted households with lower incomes—while it provided a similar dollar level, by percentage the increase was lower. →
- Increasing and redesigning benefits apparently had little impact on work. Households with the original CalFresh boost saw no related changes in employment or earnings compared to those without it. Other supports like UI and stimulus checks may have played a larger role in work decisions. →
- Higher benefits may have kept certain eligible households on CalFresh. Those who saw the first boost were more likely to remain on CalFresh while eligible and return quickly if they missed documenting eligibility in time—relative to those who did not see the boost. However, households with even fewer resources did not respond strongly to the incentive of increased benefits. →
Introduction
CalFresh, known federally as the Supplemental Nutrition Assistance Program (SNAP), helps low-income Californians afford nutritious food. It is the state’s largest poverty-reducing program: according to the California Poverty Measure (CPM), CalFresh kept 500,000 Californians out of poverty just prior to the pandemic and 1.1 million out in early 2023 (Bohn et al. 2023). The program’s broad reach and cash-like benefits—participants receive funds that can be spent on food (typically groceries) on an Electronic Benefits Transfer (EBT) card, similar to a debit card—have led the federal government to expand it in economic downturns to provide rapid aid to low-income families and boost local economies.
On March 13, 2020, the federal government declared a national state of emergency around the COVID-19 pandemic. One of its next actions, the Families First Coronavirus Response Act (FFCRA), aimed to mitigate the effects of pandemic-induced emergency shutdowns by increasing the dollar amount of SNAP benefits nationwide. Increasing SNAP benefits is a targeted recession response that can be done quickly, boosting resources for both low-income individuals and local economies (Hoynes and Schanzenbach 2019; Canning and Stacy 2019). Over the span of the pandemic (between 2019 and 2022), SNAP benefits doubled from just under $600 million each month to $1.3 billion.
In this report, we use detailed administrative data to draw lessons from this emergency response. In particular, we focus on the largest benefit increase, termed emergency allotments, the initial design of which increased benefits only for households—groups of people who live and prepare food together, known in CalFresh as “cases”—that were ordinarily not eligible for large benefits. We thus describe for whom changes in benefits and resources were largest at the start of the pandemic. The major impacts of COVID-19 on Californians and the state’s economy suggest that many CalFresh participants saw their resources outside of CalFresh change; therefore, we also document how a broader set of household resources shifted during the pandemic.
We then analyze how participation, rapid exits and reentries known as churn, and employment changed over the course of the pandemic’s early years after emergency allotments took effect. Each is a perennial challenge in the program that can potentially obstruct its primary aim of reducing food insecurity but that can be difficult to study. The temporary policy change suddenly meant changing income no longer led to changes in CalFresh benefits: a natural experiment that gives us an opportunity to assess outcomes across those who did and did not see a change. This in turn can shed light on future policymaking in California and nationally.
The Timeline of Pandemic Changes to CalFresh
Enrollment in CalFresh spiked in April 2020 and then continued to rise over the course of the pandemic (Technical Appendix Figure C1): by September 2022, the caseload was 33 percent larger than just before the pandemic in January 2020. This growth in part tracked with early changes policymakers introduced to make safety net assistance more flexible and more generous. In this section, we describe major pandemic-era changes to CalFresh; see Technical Appendix B for details and descriptions of changes to other safety net programs. The design of the largest CalFresh benefits change—emergency allotments—differed substantially from the last major effort to boost SNAP during a downturn. Amid the Great Recession, the Obama administration temporarily increased benefits 15 percent on average (Nord and Prell 2011). In both recent recessions, households had less difficulty obtaining adequate food when they received additional food assistance (Nord and Prell 2011; Schanzenbach 2023).
March 2020: Benefits increased with emergency allotments
Starting with March 2020, California began providing all CalFresh households with the maximum amount in benefits typically allotted for their size—at the time, $194 monthly for a single person. This meant families with incomes so low they were already eligible for maximum benefits saw no additional assistance. Benefit increases (emergency allotments) were authorized and funded federally by the FFCRA; the United States Department of Agriculture (USDA) initially interpreted that legislation to mean that households already receiving maximum benefits were ineligible for additional assistance.
The boost to benefits was significant, as was the change in design. Ordinarily, a family that applies for CalFresh may be eligible if their gross income falls under 200 percent and their net income under 100 percent of the federal poverty line (in spring 2020, about $2,100 monthly for a single person) after allowed deductions for earnings and costs such as dependent care, shelter, and utilities. The dollar amount of CalFresh benefits decreases as a family’s cash income increases. Under emergency allotments, this aspect of benefit calculation was suspended.
Eligibility reviews paused
FFCRA also allowed states to seek waivers to pause reviews of eligibility for households that would have had benefits recertified in March, April, or May 2020; this gave them another six months before they would need to report on changes in their resources. As a result, fewer households exited the program, and with new households continuing to enroll, the CalFresh caseload increased 19 percent between February and June 2020 (see Technical Appendix Figure C1).
April 2020: Time limits waived and online grocery purchasing allowed
Some adults without children faced time-limited assistance prior to the pandemic; these time limits were waived at the federal level starting in April 2020. In the same month, California also obtained a waiver of federal rules in order to participate in a federal pilot program letting CalFresh participants purchase groceries online.
January 2021: Benefits increased and college student eligibility changed
The federal government temporarily increased SNAP benefits by 15 percent from January to September 2021. Starting in January 2021, college students saw expanded eligibility for the duration of the public health emergency. Under CalFresh policy, college students need to be both income eligible and meet at least one additional requirement in order to be eligible (CDSS 2020d). During the pandemic, this requirement list was expanded to include work-study eligibility and documentation of no expected financial support from family for their education.
April 2021: Design of emergency allotments revised
In April 2021, USDA under the Biden administration modified allotments so that households participating in SNAP would receive at least $95 in benefits beyond what they would have been eligible for absent the boost (USDA FNS 2021). This change followed lawsuits in California and Pennsylvania that argued throughout 2020 that FFCRA did allow benefit increases for households already receiving maximum benefits.
October 2021: Benefits increased to account for changes in food costs
The USDA made planned, permanent increases to SNAP benefits after a re-evaluation of the Thrifty Food Plan (TFP) that was mandated under the 2018 Farm Bill; these changes took effect just as the 15 percent expansion from January expired. The TFP is the basis for the CalFresh benefits calculation, and estimates the cost of a “nutritious, cost effective diet”; the 2021 re-evaluation was the first in 45 years that allowed benefits to increase to reflect contemporary dietary guidelines and food preparation habits (USDA FNS 2023b).
SNAP benefits are also adjusted each October to account for inflation. The TFP recalculation and annual inflation adjustment were both applied in October 2021, and absent other expansions, the TFP change alone would have increased maximum benefits by 21 percent. With pandemic expansions in place, the TFP change meant that in practice, CalFresh households saw smaller increases working out to $12 to $16 per person, per month (USDA FNS 2023c).
Resources for CalFresh Households during the Pandemic
The average CalFresh benefit grew dramatically over the course of the pandemic, in part because of emergency allotments. The other resources households had on hand also shifted after March 2020, particularly as employment declined and unemployment insurance expanded. Using statewide administrative data, in this section we track CalFresh benefits and several other sources of income for all households actively enrolled in CalFresh: Unemployment Insurance (UI)-covered wages, CalWORKs and SSI/SSP cash assistance, and UI benefits. In other words, this section does not follow resources as they change over time for specific households.
CalFresh Benefits Grew Substantially
Even before the pandemic, CalFresh was a key resource for participants. On average, CalFresh consisted of a third of annual resources for households that enrolled at some point during the year (Malagon and Thorman 2023). Using the administrative data to zoom in, we find that CalFresh made up about 55 percent of total household resources in quarters when households were actively enrolled in 2019—which underscores the fact that from 2019 to 2022, a third or more of CalFresh households had no other source of income recorded in these data.
Four policies drove particularly large CalFresh benefit increases over the next few years: emergency allotments created in March 2020 and expanded in April 2021, the January through September 2021 benefit increase of 15 percent, and the October 2021 combination of an annual inflation adjustment with the change in benefit calculations.
Emergency allotments were a key increase
When emergency allotments were first introduced in March 2020, inflation-adjusted benefits increased 43 percent on average from February, marking a 7 percent increase in the role of CalFresh in total family resources. When allotments were expanded in April 2021, benefits increased on average 11 percent; the role of CalFresh in household resources increased 4 percent (Technical Appendix Figure C4).
Compared to families’ pre-pandemic resources, the full allotments would have been enough to lift as many as 15 percent of CalFresh households in deep poverty out of deep poverty (Malagon and Thorman 2023). CalFresh participants reported that allotments helped them purchase more nutritious food (Tan 2024), and this is reflected in national research that estimates that the allotments reduced food insufficiency by as much as 9 percent during the pandemic (Schanzenbach 2023). Regardless of the scale of the increase, for many households the allotments provided critical support during the pandemic (Tan 2024).
Overall, CalFresh benefits grew substantially during the pandemic. Figure 1 shows little change in benefits from July 2019 through February 2020; starting in March 2020, benefits increased substantially. Overall, between July 2019 and September 2022, total monthly benefits increased by 179 percent, and the average benefit doubled (105% growth). Inflation, however, eroded the value of this growth. In every month of 2022, prices were up more than 6 percent over the prior year, compared to an average of 1.96 percent in pre-pandemic months (Brown 2024).
CalFresh benefits increased throughout the pandemic, but growth was offset by inflation
Increase relative to July 2019 (%)

SOURCE: Authors’ analysis of Monthly Medi-Cal Eligibility Data System Eligibility Files (MEDS MEF) and Electronic Benefits Transfer (EBT) / Statewide Automated Reconciliation Systems (SARS) data.
NOTE: Chart shows changes relative to July 2019, accounting for changes in household composition (dollar values adjusted to give all households equivalent sizes of one person). “Total CalFresh benefits” describes total dollars issued in month, not adjusted for inflation. “Average household benefits” describes dollars issued divided by number of households. See Technical Appendix A for how we adjusted dollar amounts to reflect a household size of one.
Energy and gasoline prices saw particularly high inflation, followed by food: the cost of food increased about 20 percent between January 2020 and September 2022 (Brown 2024). Accounting for overall inflation, average CalFresh benefits increased by 77 percent between July 2019 and September 2022.
Only certain households received March 2020 allotments
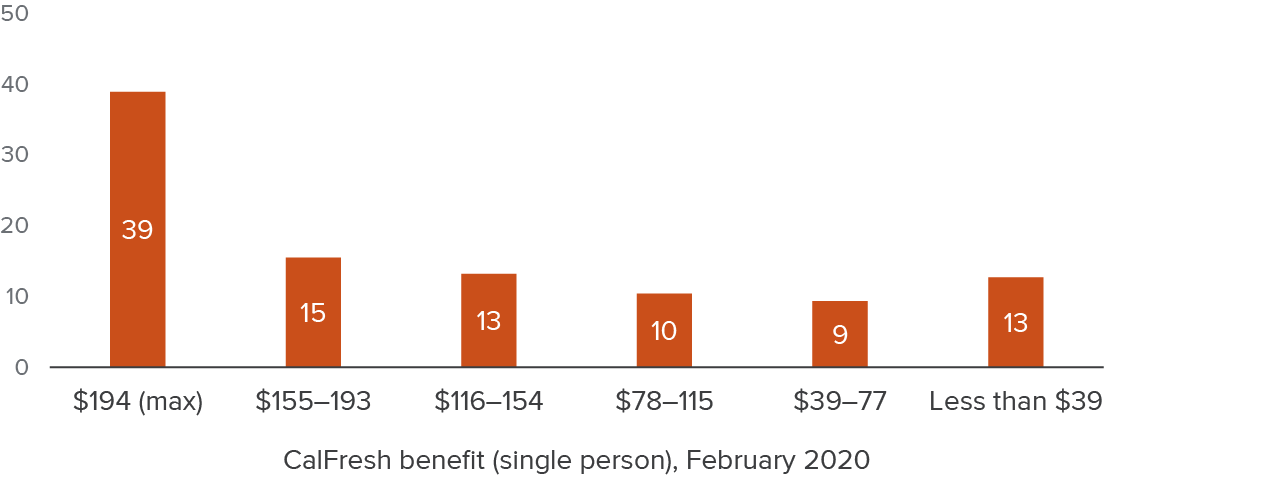
Although benefits were higher across the board by September 2022 than before the pandemic, increases rolled out unevenly. Emergency allotments introduced in March 2020 focused on CalFresh households who were eligible for less than the maximum benefit, like 61 percent of those enrolled in February (Figure 2). A year later, April 2021 allotments were adjusted to also assist those who were already receiving the maximum.
Benefit increases in March 2020 also varied in scale. About 15 percent of households enrolled in February were eligible for a boost but had benefits so close to the maximum that their benefits increased by less than 25 percent with the allotment (for a one-person household, an increase of at most $39). The remainder of eligible households (46%) saw larger increases.
Allotments in March 2020 had a bigger impact on CalFresh benefits than the revised calculation in April 2021. At the median, benefits increased by 85 percent for households that saw an increase in 2020, versus by 40 percent in 2021. However, the increases reached a similar share of households (58% and 56%, respectively; Technical Appendix Table D1).
Almost half of CalFresh households were at maximum or near maximum benefits before the pandemic
% of households
SOURCE: Authors’ analysis of Monthly Medi-Cal Eligibility Data System Eligibility Files (MEDS MEF) and Electronic Benefits Transfer (EBT) / Statewide Automated Reconciliation Systems (SARS) data.
NOTES: Chart shows shares of CalFresh households in spring 2020. Dollar values pertain to a household size of one person, the most common size. Households are divided into (1) those with the maximum benefit (leftmost bar), and (2) quintiles by benefit of the remaining households. Households shown in the second through sixth bars received a benefit increase in March 2020, primarily because of emergency allotments. See Technical Appendix A for how we adjusted dollar amounts to reflect a case size of one.
Income Sources Shifted during the Pandemic
Understanding sources of income beyond CalFresh is important to give context to pandemic allotments. While many households appear to rely heavily (or entirely) on their CalFresh benefits, at least half have income from their own employment, from unemployment insurance, or from cash-based safety net programs (Figure 3).
Typical monthly income sources changed during the pandemic for CalFresh households
% with income

SOURCE: Authors’ analysis of Monthly Medi-Cal Eligibility Data System Eligibility Files (MEDS MEF), Electronic Benefits Transfer (EBT) / Statewide Automated Reconciliation Systems (SARS), and Employment Development Department base wage file and UI payments data.
NOTES: Chart shows share of active households with any resources from SSI/SSP and CalWORKs each month and share of households including at least one adult with resources from earnings, UI, or CalFresh only each month. Households could have had multiple sources of non-CalFresh resources. “Earnings” at monthly level indicates any earned income in calendar quarter, for households enrolled in a given month. “CalFresh only” indicates resources from no other income source apart from CalFresh in the month. Vertical lines show timing of emergency allotment policies. SSI/SSP is Supplemental Security Income/State Supplementary Payment.
Earned income
The economic downturn in spring 2020 impacted CalFresh participants both by reducing employment and, for some who lost earned income, by replacing some of it with income that CalFresh matches at a lower rate than it does earnings.
Before the pandemic, about a third of actively enrolled households with at least one enrolled adult had some earned income from UI-covered jobs each month in the calendar quarter (Figure 3). When COVID cases spiked in early 2021, this share reached a low of 24 percent. It rebounded to just under a third in late 2022.
After adjusting for inflation, average earnings were lower at the start of 2020 than at the end of 2019 among those where any household members had UI-covered jobs (Technical Appendix Figure C3; $2,700 for the quarter, in terms of a one-person household, compared to $2,900). Those earnings grew somewhat thereafter, reaching about $3,200 by the second quarter of 2022. For these households, CalFresh made up 20 to 25 percent of all resources during the pandemic (Technical Appendix Figure C4).
Unearned income
CalFresh is designed to decrease with each additional dollar of income, but benefits decrease less for each additional dollar of earned income than for income from other sources: benefits decrease by $0.80 for earned and $1.00 for unearned income. In other words, a household with all of their non-CalFresh income from earnings would receive more in CalFresh benefits than an otherwise identical household that had some “unearned income,” such as UI benefits. The presence of children (vs. only adults) in a household also leads to higher CalFresh amounts, all else equal, because they increase household size but not earned income.
Unemployment insurance
Income from UI took on new importance during the early years of the pandemic (Figure 4). From April 2020 to September 2021, the program was expanded to provide additional benefits—a $600 a week supplement lasted through July 2020, and a $300 supplement was added back in December 2020. UI also became available to self-employed and gig workers and to business owners, and it was extended to last beyond the standard 26 weeks (EDD 2024).
In the last months of 2019, just 2 percent of CalFresh households that included any enrolled adults received UI. A year later, that share had climbed to 27 percent (Figure 4). This surge was broadly shared; more than 70 percent of unemployed Californians were receiving UI in the second half of 2020, compared to about 20 percent pre-pandemic (Bell et al. 2022).
Still, pandemic-era expansions of unemployment insurance were particularly important for CalFresh participants; Californians were more likely to receive regular UI if they lived in higher-income communities, with fewer CalFresh participants (Bell et al. 2021).
At peak dollar amounts, in June 2020, the average CalFresh household with any UI income received $1,400 a month from UI (in terms of a one-person household). In December 2020, the month when the highest share of households had income from UI, that dollar amount was about $800 (Technical Appendix Figure C3).
Typical safety net income sources changed during the pandemic for CalFresh households
% with income

SOURCE: Authors’ analysis of Monthly Medi-Cal Eligibility Data System Eligibility Files (MEDS MEF), Electronic Benefits Transfer (EBT) / Statewide Automated Reconciliation Systems (SARS), and Employment Development Department UI payments data.
NOTES: Chart shows share of active households with any resources from SSI/SSP and CalWORKs each month and share of households including at least one adult with resources from UI. Households could have had multiple sources of non-CalFresh resources. Vertical lines show timing of emergency allotment policies. SSI/SSP is Supplemental Security Income/State Supplementary Payment.
Supplemental Security Income/State Supplementary Payment
Most SSI/SSP beneficiaries are low-income adults who are unlikely to be working due to age or significant health limitations (just 6% to 9% had any earned income during the pandemic). As such, SSI/SSP is a primary source of income for enrolled CalFresh participants. Still, emergency allotments dramatically increased the role of CalFresh in resources for these participants, who because of age and health concerns may have been particularly vulnerable during the pandemic.
Before the pandemic, CalFresh made up about 14 percent of resources for households with SSI/SSP; emergency allotments increased that share to 25 percent or more throughout the pandemic (Technical Appendix Figure C4). Between 2019 and 2022, the average CalFresh household with any SSI/SSP had between $600 and $700 a month from that program (in a one-person household). Adjusted for inflation, this amount represented about a 7 percent decline over the time period (Technical Appendix Figure C3).
Californians with SSI/SSP benefits became eligible for CalFresh less than a year before the pandemic (June 2019). Between the start of their eligibility in June 2019 and right before the pandemic’s start (February 2020), participation stabilized at about a fifth of CalFresh households (Figure 4).
CalWORKs
CalFresh plays an even larger role in family finances for participants enrolled in CalWORKs, which provides cash assistance and work supports like childcare to very low-income families with young children, nearly all of whom are also enrolled in CalFresh. Although families with CalWORKs were about as likely as all CalFresh households to have earnings or UI benefits during the pandemic, CalFresh made up a third or more of their monthly resources on average (Technical Appendix Figure C4).
A CalFresh household with any income from CalWORKs received between $300 and $350 monthly on average from that program during the pandemic, although cash grants fell 3 percent between 2019 and 2022 (Technical Appendix Figure C3). CalWORKs families also received additional boosts in two months in 2021: $600 from the Golden State Grants in March (which SSI/SSP recipients also qualified for), and $640 from the TANF pandemic emergency fund in July (CDSS 2024).
Yet participation in CalWORKs declined steadily from 2019 onwards, from 16 percent of CalFresh households in July 2019 to 11 percent in summer 2022 (Figure 4); this reflects a longer-term decline in the overall CalWORKs caseload that lasted until about fall 2021 (Legislative Analyst’s Office 2024). Before the pandemic, the decline was in part a factor of improving economic circumstances and demographic changes, but also fewer eligible families enrolling (Legislative Analyst’s Office 2020; Legislative Analyst’s Office 2021a). During the pandemic, the decline may have also reflected the availability of other options for families seeking economic support that required fewer steps to get and keep assistance (Legislative Analyst’s Office 2022), along with fewer successful applications—perhaps because of challenges accessing assistance with county offices closed (Legislative Analyst’s Office 2021b).
Zero income beyond CalFresh
CalFresh is particularly vital for those households with no other regular income. For some, this situation reflects a total lack of other income, and accompanying reliance on savings, taking on debt, or help from friends, family, or charities.
However, for other households, this situation reflects data limitations. For example, during our study period (between 2019 and 2022), many active CalFresh households that included at least one adult had no income but CalFresh recorded in the administrative data we access in any given month (Figure 3, earlier). That share fell from more than 40 percent pre-pandemic to 30 percent in fall 2020, when unemployment insurance was temporarily expanded. This finding suggests that in ordinary times, UI-covered earnings data could understate income from work for a number of households; the share with no significant income outside CalFresh is likely closer to 30 percent, even in ordinary times. See Technical Appendix to Danielson and Thorman (2022) for further discussion.
Households Boosted Most by Emergency Allotments
Emergency allotments initially targeted low-income families with cash incomes high enough to make them ineligible for large CalFresh benefits. Such an approach underscored that the CalFresh benefit calculation treats earnings and cash-based social safety net benefits differently. While in the aggregate, the emergency allotment changes were large, an unintended effect of the rollout was the potential to disproportionately support some low-income Californians more than others. We next examine how allotments varied across demographic and geographic groups, by focusing on households continuously enrolled when benefits increased (on CalFresh in the month of the benefit increase and the preceding month).
March 2020 Allotments Targeted Higher Earners; April 2021 Changes Compensated
The March 2020 emergency allotments gave more assistance to households that had more resources beyond CalFresh from earned income, UI, or safety net programs. For households that initially received allotments, CalFresh had made up 50 percent of resources the month before; for those that did not receive allotments, CalFresh had made up 74 percent of their resources.
Households with current or recent (within the year before the pandemic) earnings were roughly evenly spread across the groups that received different sizes of allotments (Figure 5): 27 percent of those with large allotments had earnings, as did 32 percent of those with small allotments, and 25 percent of those with none. While earnings are key in many CalFresh households, there is a large group who work but earn so little that they are eligible for substantial amounts from CalFresh.
Among households with key sources of unearned income, the picture was different. Almost one in three households (30% to 31%) that received any March allotment had some income from SSI/SSP in February, compared to just 9 percent of households that saw no allotment. And CalWORKs was far more common among those with a small allotment (24% of households) than those with no (8%) or large (3%) allotments.
CalFresh households that saw a large benefit increase in March 2020 were more likely to have income from SSI/SSP
% with income source

SOURCE: Authors’ analysis of Monthly Medi-Cal Eligibility Data System Eligibility Files (MEDS MEF), Electronic Benefits Transfer (EBT) / Statewide Automated Reconciliation Systems (SARS), and Employment Development Department base wage file data.
NOTES: Chart shows share of households with income from each source, among those with no, small, or large changes in CalFresh benefits between February and March 2020. “Large” increase means benefit in February was <20 percent of maximum; “Small” means it was at least 20 percent of maximum. SSI/SSP and CalWORKs income refer to February 2020, and “current or recent earnings” refers to the 18 months before the pandemic. Households could have had income from multiple sources, other sources (not shown), or no recorded cash income (not shown). Cohort includes those on CalFresh in both February and March 2020 with no household size change in those two months.
The adjustment to allotments in April 2021 targeted assistance to households not eligible for the first increase, and as such, beneficiaries of the full $95 increase were much less likely to have SSI/SSP income or recent earnings (9% and 19% of recipients, respectively; Technical Appendix Figure C2).
Timing of allotments varied by demographics and geography
With income levels and sources playing a large role in determining whether households saw a boost in March 2020 or in April 2021, it comes as no surprise that we find demographic differences in when households received allotments. Income sources vary across demographic groups, reflecting how cash-based safety net programs target families with young children and those with disabilities, and how earnings are unlikely in households without working-age adults.
The timing of allotments varied between demographic groups because household size and income also vary (Table 1), even though the dollar amount did not differ much along demographic lines for households that were otherwise similar in size and income (see Technical Appendix Table E1). For example, older adults were a large share of the beneficiaries of March 2020 allotments, consistent with their higher receipt of SSI/SSP. Over a third (36%) of households that saw a large allotment in March 2020 were composed exclusively of older adults (65+), compared to just 7 percent of households that saw no allotment.
Population age differences may also partially explain why Latino-headed households were underrepresented among those with large benefit increases (29%, when 37% of households were Latino), and white and Asian/Pacific Islander households were overrepresented. California’s younger population is on average more Latino, while its older population is on average more white (Johnson et al. 2024).
Shares of CalFresh households by receipt of March 2020 allotments

SOURCE: Authors’ analysis of Monthly Medi-Cal Eligibility Data System Eligibility Files (MEDS MEF) and Electronic Benefits Transfer (EBT) / Statewide Automated Reconciliation Systems (SARS) data.
NOTE: Race/ethnicity refers to that of oldest household member. “Age mix” describes all case members; average age refers to age of oldest household member. Includes households on CalFresh in both February and March 2020 with no household size change in those two months. “Large” increase means regular CalFresh benefit in February 2020 was less than 20 percent of maximum; “Small” means February benefit was 20 percent or more of the maximum. Child-only households do not have an eligible adult living in the household. See Technical Appendix Table D1 for additional demographics for households with March 2020 and/or April 2021 allotments.
Demographic differences were reversed for the April 2021 allotment, consistent with the policy’s logic of aiding those who were not yet seeing any extra assistance. For example, an outsized share of households with no boost in April were older adults. However, we find fewer racial/ethnic differences with the 2021 allotment than the 2020. (See Technical Appendix Table D1.)
With or without emergency allotments, households in some parts of the state are more likely to be eligible for maximum benefits than households in others. This is because CalFresh rules for calculating eligibility and benefits apply statewide, but factors that shape income levels—like employment opportunities, costs of living, and demographics—vary between counties.
Households in the Bay Area, Northern region, and San Diego County were most likely to receive a large allotment in March 2020 (Figure 6); they had lower shares of cases that were already receiving maximum benefits. This likely reflects a variety of drivers, including higher wages and costs of living in the Bay Area and San Diego, and fewer households with children participating in the Bay Area and Northern region. Differences were smaller across regions in shares that received full April 2021 allotments.
Households in Bay Area, San Diego, and Northern region counties were more likely to receive large allotments in March 2020
Large boost

SOURCE: Authors’ analysis of Monthly Medi-Cal Eligibility Data System Eligibility Files (MEDS MEF) and Electronic Benefits Transfer (EBT) / Statewide Automated Reconciliation Systems (SARS) data.
NOTES: Chart shows ratio of households with a large boost to households with no change in benefits; 1 indicates equal likelihood. For March 2020, “large” means benefits in February were less than 20 percent of maximum for household size. For April 2021, “large” means a $95 change between March and April. See Technical Appendix A for definitions of regions.
Combining CalFresh and Employment
CalFresh benefits are generally not conditioned on employment status because the program’s primary aim is to prevent hunger. Availability to participants for as long as they are income-eligible and availability to all Californians (in contrast to programs targeted to families with children, older adults, or those with disabilities) are part of what makes it California’s largest poverty-reducing program. However, for nearly three decades, federal policy has restricted food assistance for certain unemployed adults, although these time limits likely do not increase employment for affected adults (Gray et al. 2023; Bauer and East 2023).
In California, people frequently become eligible for CalFresh after a job or income loss, but fully 80 percent of CalFresh households that include working-age adults either combine benefits with earnings or use them as a backstop during short periods of unemployment—as was particularly common at the start of the pandemic (Danielson and Thorman 2022). California state policy is to adopt the broadest possible interpretation of waivers to federal work requirements to help ensure that the program supports food access both for those connected to the labor market and those unable to work (CDSS 2005).
The pandemic’s wide-ranging impacts make it difficult to isolate whether the changing design of CalFresh under the emergency allotment policy also played a role in work decisions. However, allotments created a natural experiment: a sudden change in benefit design that may have altered individual calculus about how to combine earnings and CalFresh to meet basic needs. Without the program’s ordinary reduction in benefits as incomes rise, participants could in theory have worked more (up to a point) or less without seeing their benefits change. We leverage this temporary policy change to examine whether employment decisions changed among a subset of CalFresh adults with recent, pre-pandemic employment.
Emergency Allotments Did Not Affect Employment
In March 2020, work changed dramatically for many Californians because of COVID-19. Unemployment spiked as businesses shuttered, some jobs switched to remote, employers cut back on hours, caregiving arrangements collapsed, and health concerns took precedence (Bohn et al. 2021a; Parker et al. 2020; Lofton et al. 2021). Workers earning low wages in the hospitality and recreation sectors saw particularly high job losses (Bohn et al. 2021b), and remaining jobs were concentrated in essential roles that posed higher health risks (Michaels et al. 2024; Chen et al. 2021). Hospitality is a top sector of employment for CalFresh participants, and shares of CalFresh households working in that sector fell 18 percent between the first and second quarters of 2020; the administration sector, another large sector for CalFresh participants, fell 15 percent.
Amidst these broad labor market shifts, the March 2020 boost to CalFresh that also redesigned the benefit calculation likely did not incentivize those who received it to leave the labor market more or less than it did those who saw no boost (see Technical Appendix Table E5). Employment and earnings trended similarly for the comparison groups of recent earners (Technical Appendix Figures C5 and C8).
The associations between any employment and receiving a benefit increase were negative but insignificant when we use regression analysis to compare those who did and did not see the change; differences in earnings were also not systemically related to the policy change. Allotments represented a small share of earnings for this group: at the median, those employed at the time saw an allotment worth up to 12 percent of their monthly earnings, which was likely small compared with support received from stimulus checks. And further, although by May 2020 allotments were made available for the duration of the public health emergency declaration, states needed to choose monthly to provide them—meaning that in any given month, participants may not have had a guarantee that they would continue to receive an allotment. This may have complicated participants’ ability to make decisions based on an expectation of ongoing benefit levels.
By spring 2021, California was emerging from a spike in COVID-19 cases (see Technical Appendix Figure C1), and while unemployment remained high at over 8 percent, it had been cut in half since April 2020 (Bohn 2023). Jobs were slowly returning to the sectors hit hardest by the pandemic, and wages in low-wage sectors were growing (Bohn et al. 2021b).
Our findings are broadly consistent with national research that finds that SNAP benefits do not discourage work. We do see some mixed evidence on the April 2021 boost to CalFresh, which was worth at most 6 percent of average monthly earnings, and may have had a small, negative association with work. Households with new allotments in April were slightly less likely to be employed while on CalFresh in the quarter after the policy change as compared to those who did not see the new allotment (see also Technical Appendix Table E5). Earnings while enrolled in CalFresh were also lower just after the change, pointing to reduced hours or short periods without work; for households with children, lower earnings while enrolled in CalFresh continued on a smaller scale (Technical Appendix Table E6).
Remaining on CalFresh while Eligible
Households must periodically submit paperwork to confirm that they remain eligible for CalFresh. This is a major exit point in the program, and many that exit do so despite remaining eligible—such that they can restart benefits in short order, but after a gap. Before the pandemic, on average 18 percent of exiting CalFresh households re-enrolled within 3 months (Unrath 2021).
Brief gaps in CalFresh participation of a few months or less, or “churn,” are disruptive for these eligible participants and raise administrative costs for local governments. Churning also contributes to the comparatively low rate of eligible California households enrolled in SNAP.
The rapid growth of the CalFresh caseload between March and May 2020 (Technical Appendix Figure C1), when California suspended recertifications, is indirect evidence of the same issue. The steps required to demonstrate ongoing eligibility, or the administrative burden, can be a major contributing factor to churn (Kenney et al. 2022; Mills et al. 2014; Homonoff and Somerville 2021).
Emergency allotments allow us to examine the role benefit amounts play in whether households stay up-to-date with counties in terms of documenting their eligibility to remain on CalFresh: those who saw larger benefit increases during the pandemic may have had a greater incentive to complete tasks to maintain benefits that otherwise are too burdensome for some participants, although caveats about the comparability of the groups that did and did not see the increases apply here again (as described above).
We track both cases of households that remained on CalFresh and households that churned off and back onto CalFresh, while adjusting for factors that play into ongoing eligibility: the county unemployment rate and household earnings, CalWORKs, and SSI/SSP amounts. For this analysis, we focus on households that include at least one adult since we cannot account for outside resources in households where only children receive CalFresh.
A Higher Boost Was Associated with Continued Participation
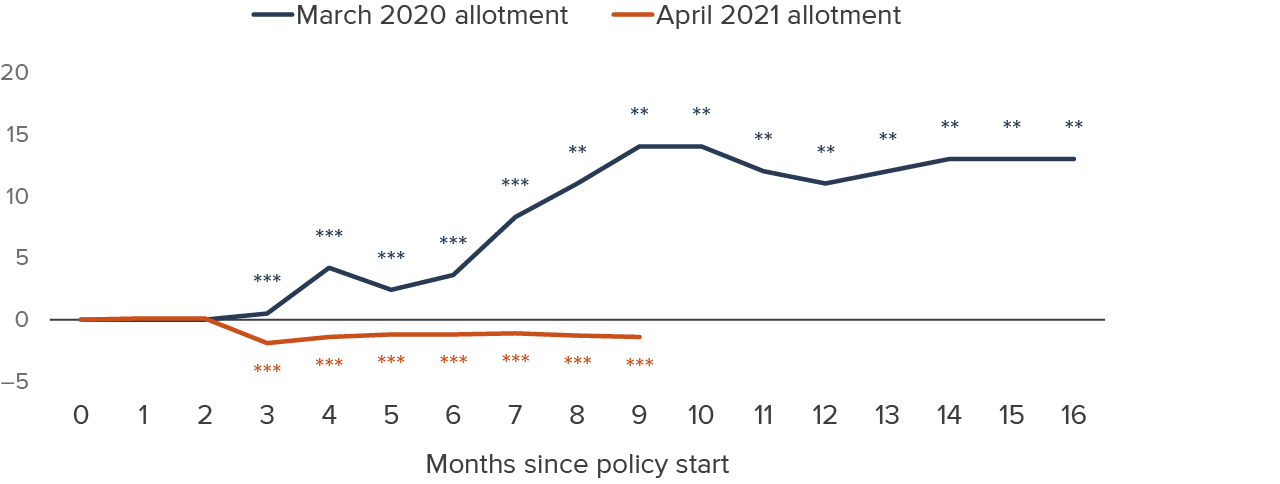
Households that received the initial pandemic boost were substantially more likely to remain on CalFresh relative to those ineligible for the boost (Figure 7). Approximately 8 to 15 months after the first allotment, CalFresh participation was 11 to 14 percentage points higher for households that saw the boost than for those that did not. This is equivalent to a 14 to 18 percent increase above the baseline average participation across the months that we track the analysis cohort.
These estimates account for key factors that affect eligibility, indicating that rather than reflecting changes in eligibility that differed between groups, higher benefits may have helped to keep CalFresh households on while they remained eligible. The estimates are larger for households without children than for those with children, suggesting that adult-only CalFresh households might be particularly motivated by higher benefits to stay enrolled in CalFresh.
Households with the first pandemic boost were also much more likely to have brief gaps in participation (Technical Appendix Table E4). In other words, if they lost benefits while remaining eligible, households that had gotten the allotment were much more likely to go through the process to requalify for benefits quickly than households that had not gotten the allotment. While churning is a concern, it ultimately represents a better outcome than leaving CalFresh and remaining without benefits despite being eligible.
The evidence is quite different for the April 2021 allotment policy. Continued participation fell with the revised policy by a statistically significant but small amount (1 to 2 percentage points). Participation for households with children rose by 1 to 3 points, while participation for households of adults only fell by 2 to 3 points. We also see mixed evidence of any changes to churning in the wake of the policy change. As we have noted, the second boost was smaller than the first, and affected a group of CalFresh participants with even lower incomes. Different responses to increased benefits by this group could indicate that being deep in poverty makes it even harder to complete necessary steps to continue benefits, in line with other existing evidence (Christensen et al. 2020).
Eligible households that saw pandemic increases to their CalFresh benefit were more likely to continue on the program
Percentage point difference in being on CalFresh
SOURCE: Authors’ analysis of Monthly Medi-Cal Eligibility Data System Eligibility Files (MEDS MEF), Electronic Benefits Transfer (EBT) / Statewide Automated Reconciliation Systems (SARS), and Employment Development Department base wage file and UI payments data.
NOTES: ** 0.01, *** 0.001 indicate significance levels. Figure shows estimates from a linear probability model of interactions between being on CalFresh, receiving an allotment, and calendar month dummies. Sample excludes child-only households, and March 2020 model omits months following policy change (March, April, and May 2020), when recertifications were paused. See Technical Appendix Table E4 for complete regression results.
Across the two pandemic-era boosts, the evidence suggests that households did respond to the first boost in a substantial way. However, the first and second boosts were targeted at different segments of the CalFresh caseload. Households with slightly higher incomes tended to take the required steps to continue participating in the program. For those with the lowest incomes, the increased incentive had much smaller effects on their continued participation in CalFresh.
Conclusion and Recommendations
Increasing SNAP benefits can efficiently bring timely support to low-income families during economic downturns, but the pandemic-era application of this strategy was quite different from the federal approach during the Great Recession: rather than increasing benefits for all households and maintaining differences by income levels, allotments made the benefit a flat amount not tethered to changes in income (for as long as households remained income-eligible for the program). Reflecting on this approach can inform policy discussions going forward.
- A sizeable share of CalFresh households have limited or even no monthly income beyond their CalFresh benefit. The first phase of emergency allotments bypassed these households, assisting the 61 percent of CalFresh households whose relatively higher incomes ordinarily make them ineligible for the largest benefit amounts; the second phase reached the rest of CalFresh households a year later, in April 2021.
- Differences in how CalFresh treats earned and unearned income meant that emergency allotments substantially boosted incomes for the 20 percent of CalFresh households enrolled in SSI/SSP. CalWORKs participants also saw increases, but they were smaller.
- Redesigning and boosting CalFresh benefits for the March 2020 allotments likely had no impact on employment or earnings. Health concerns, unemployment insurance, and other potentially high-dollar value cash supports like stimulus funds may have impacted decisions about work more than CalFresh emergency allotments did.
- Those who saw the March 2020 boost were also more likely to remain enrolled and to return quickly to CalFresh if they dropped off the program. Effects were larger for households without children. These results suggest the higher benefits did outweigh some of the barriers to participation that in normal times result in substantial shares of those exiting CalFresh doing so while still remaining eligible. However, the lowest-income participants did not see similar effects after the boost in April 2021, suggesting that administrative burdens and other external factors may play a larger role in driving exits while still eligible for this group.
Approaches for Future CalFresh Policy Design
As state policymakers consider future options for meeting the goals of CalFresh in a variety of economic climates, it is important to examine where improvements would require state spending, and where they could come from drawing down federal dollars—particularly when state spending is constrained.
Making more Californians eligible for CalFresh or increasing benefits generally requires state funds, because SNAP is a federal program. California can also draw down additional federal dollars by increasing participation among Californians eligible for federal benefits, and this remains important to state policymakers. The two recommendations below might be best addressed at the federal level, but this does not preclude state action, even if narrowly targeted. After all, recent additions to CalFresh by California policymakers include a planned expansion of food assistance to older undocumented adults in 2027 and a pilot of a higher minimum benefit amount ($50, up from $23).
First, the overall design of emergency allotments provided a smaller sum to lower-income households, even accounting for the modifications in 2021 to ensure that all households saw some additional assistance. Two approaches to consider in future emergency responses that would distribute assistance more equitably across households include increasing benefits for all by a percentage or focusing the largest increases on households with the lowest cash incomes. For example, Hoynes and Schanzenbach (2019) propose that benefits increase automatically by a set percentage when the economy falters.
Second, state policymakers should consider how best to ensure that households enrolled in both CalFresh and other safety net programs can meet their basic needs. These households are eligible for programs like SSI/SSP and CalWORKs precisely because they face barriers to earning sustaining incomes, but they receive lower CalFresh benefits than those with similar amounts of earned income—as highlighted by the overrepresentation of SSI/SSP recipients among households with March 2020 emergency allotments. Recent increases to both SSP (the state-funded part of the SSI grant) and the CalWORKs cash grant were partly undercut by this differential treatment of cash assistance. Potential state avenues to support these households include ensuring households deduct all eligible expenses so that they can receive their full CalFresh benefits, seeking waivers to federal requirements, supplementing CalFresh, or additionally boosting cash benefits.
Looking forward, CalFresh has a few new federal dimensions, more than a year after the end of the pandemic states of emergency. In 2023, the government temporarily raised the upper age for adults who can face time limits on SNAP benefits (from 50 to 52; in October 2024, the age increases to 54) and permanently added supporting work—helping participants obtain employment and increase earnings—to the program’s statutory purpose (USDA FNS 2023a).
Further, perennial debates on benefit amounts and on employment-based restrictions could reappear in debates over the Farm Bill. The Farm Bill is the legislation underpinning SNAP, and a majority of its spending goes to nutrition programs; because it was not reauthorized in 2023, details of its reauthorization remain to be determined. As California faces these and other changes, reflecting on the impacts of pandemic-era emergency allotments provides a valuable opportunity to consider how state policy can work with or supplement federal policy to ensure that CalFresh is achieving the program’s core goals.
Topics
COVID-19 Health & Safety Net Poverty & Inequality