Key Findings
The state legislature and governor have been working to close a multibillion-dollar budget gap between spending and revenues. The presidential candidates agreed to two debates—on June 27 and September 10—while their campaigns reacted to the trial and verdict on felony charges against Donald Trump. The national and state economy continues to send mixed signals with inflation and job growth. The California ballot is taking shape with a June 27 deadline looming for state propositions.
These are the key findings of the Californians and Their Government survey on state and national issues, conducted May 23–June 2, 2024:
- Joe Biden (D) leads Donald Trump (R) by a wide margin (55% to 31%) in the presidential race; 36 percent of California likely voters are “very interested” in their upcoming debates. Adam Schiff (D) leads Steve Garvey (R) by a 25 point margin (62% to 37%) in the US Senate race; 20 percent are “very interested” in a series of debates and town halls with the two candidates. Democratic candidates lead Republican candidates in local House district races by a 26 point margin (62% to 36%); 30 percent are “extremely” or “very” enthusiastic about voting for Congress this year. When asked about state ballot items, majorities say this is a “bad time” for state bonds and would vote no on both a citizens’ initiative to raise the threshold for new state and local taxes and a legislative initiative to lower the vote threshold to pass some local taxes and bonds. →
 Forty-two percent of Californians say that the state’s budget situation is a “big problem.” Fifty-four percent of residents favor the May revision of the governor’s state budget plan; specific proposals for spending cuts and the use of the rainy-day funds receive more mixed reviews. Most say that K–12 education or health and human services are their top priorities for state spending. Majorities would rather pay lower taxes and have a state government that provides fewer services. Majorities favor raising the state taxes paid by the wealthiest Californians and the largest California corporations. Sixty-five percent think that property tax limits passed in 1978’s Proposition 13 have been mostly a good thing for California. →
- Most Californians say that economic conditions, housing affordability, and homelessness are the most important issues facing the state today. Majorities of Californians and likely voters say that the state is headed in the wrong direction and expect the state to have bad times financially in the next 12 months. Forty-seven percent of adults say their personal finances are about the same as a year ago and 48 percent are somewhat satisfied with their financial situation; 29 percent say that the cost of housing places a lot of financial strain on them. Forty-four percent of adults and 47 percent of likely voters approve of the job performance of Governor Newsom, and majorities disapprove of the state legislature and their own assembly and state senate representatives. →
 Most Californians say that economic conditions, government in general, and immigration are the most important problems facing the US today. Solid majorities of Californians and likely voters think the nation is generally going in the wrong direction and will face bad economic times over the next year. Fifty-six percent are “very concerned” about the price of food and consumer goods in the country today, while 35 percent are “very concerned” about people who want to work being unable to find jobs. Forty-two percent of adults and 50 percent of likely voters approve of President Biden’s job performance, and solid majorities disapprove of the US Congress and their local US House representative. →
November Election
The statewide ballot in the November election will include the presidential race and the US Senate race. California voters will also be electing 52 House members, and competitive races may help decide the party in control of a closely divided Congress. The state propositions for November—including legislative measures, citizens’ initiatives, and a referenda—have a June 27 deadline.
US presidential race. The presidential primary season concluded with both President Joe Biden and former president Donald Trump in firm control of their party’s nomination. While national polls indicate a close race, California likely voters would choose Joe Biden (D) over Donald Trump (R) by a wide margin (55% to 31%) if the November election were held today. Preferences in the presidential race were similar in April (54% Biden, 31% Trump).
Partisans continue to overwhelmingly prefer their party’s candidate, even as Biden faced criticism over Middle East policy within his party and as Trump was on trial and was convicted of felonies. Eighty-six percent of Democrats support Biden and 81 percent of Republicans favor Trump. Biden leads Trump across age, education, gender, income, and racial/ethnic groups and across the state’s major regions; independents also favor Biden over Trump (41% to 32%). Thirteen percent of likely voters would vote for “someone else” for president, including 8 percent of Democrats, 7 percent of Republicans, and 26 percent of independents. Few are undecided about the presidential race.
The Biden and Trump campaigns have agreed to two debates on June 27 and September 10. When asked how interested, if at all, they are in the upcoming presidential debates, 36 percent say they are “very interested” (32% somewhat, 22% not so, 10 % not at all). By comparison, 62 percent were “very interested” in the Clinton-Trump presidential debates in 2016, and 57 percent were “very interested” in the Biden-Trump presidential debates in 2020. Today, Trump voters (47%) are more likely than Biden voters (35%) to say they are “very interested,” while fewer than half across parties, demographic groups, and regions say they are very interested in the upcoming debates.
Joe Biden continues to lead Donald Trump by a wide margin

SOURCE: PPIC Statewide Survey, June 2024. Survey was fielded from May 23-June 2, 2024 (n=1,677 adults and n=1,098 likely voters).
NOTES: Among likely voters only.
US Senate race. Adam Schiff (D) leads Steve Garvey (R) by a wide margin (62% to 37%) in the US Senate race. Ninety-three percent of Democrats favor Schiff and 90 percent of Republicans favor Garvey—while independents are more evenly divided (53% Schiff, 45% Garvey). Majorities across demographic groups and in the coastal regions favor Schiff over Garvey. Preferences in the US Senate race were similar in April (61% Schiff, 37% Garvey). Twenty percent of likely voters are “very interested” in a series of debates and town halls with the two US Senate candidates (36% somewhat, 31% not too, 13% not at all). Garvey’s supporters (28%) more often than Schiff’s supporters (15%) say they are very interested in debates and town halls.
Adam Schiff leads Steve Garvey by a wide margin

SOURCE: PPIC Statewide Survey, June 2024. Survey was fielded from May 23-June 2, 2024 (n=1,677 adults and n=1,098 likely voters).
NOTES: Among likely voters only.
US House races. When asked about their House district race, likely voters choose the Democratic over the Republican candidate by a wide margin (62% to 36%). In the 10 competitive districts (as defined by the Cook Political Report), support is higher for the Democratic candidate than for the Republican (59% to 39%). Nine in ten or more Democratic and Republican likely voters would choose their party’s candidate, while independents are more divided. Across demographic groups and in the coastal regions, majorities favor the Democratic candidate over the Republican. Preferences in the US House race were similar in April (60% Democrat, 38% Republican). Thirty percent of likely voters are “extremely” or “very” enthusiastic about voting for Congress this year. Fewer than four in ten across parties, regions, and demographic groups hold this view. In the competitive House races, 37 percent are “extremely” or “very” enthusiastic about voting for Congress this year.
State fiscal ballot initiatives. Do likely voters favor or oppose the fiscal policy measures that have qualified, are eligible, or are being considered for the November ballot? Thirty-four percent say this is a “good time” and 64 percent say this is a “bad time” to issue state bonds for state programs and infrastructure projects. When read the title and summary for the citizens’ initiative on new state and local tax limits, 32 percent would vote yes and 63 percent would vote no; majorities are saying no across partisan and demographic groups and across regions. When read a brief description of two legislative measures, 45 percent would vote yes and 53 percent would vote no on replacing the two-thirds vote requirement with a 55 percent majority to pass local tax and bond measures for public infrastructure and affordable housing; on an amendment requiring that a two-thirds vote threshold be approved by two-thirds of voters, 58 percent would vote yes and 37 percent would vote no.
A solid majority of California likely voters would vote for the Democratic candidate if the 2024 election for the House of Representatives were held today

SOURCE: PPIC Statewide Survey, June 2024. Survey was fielded from May 23-June 2, 2024 (n=1,677 adults and n=1,098 likely voters).
NOTES: Among likely voters only.
State Budget and Governor’s May Revise
In May, Governor Newsom released a revision to his January budget proposal that includes $288.1 billion in spending and an estimated a $27.6 billion budget shortfall that accounts for $17.3 billion in savings from agreed-upon budget cuts. Most Californians and likely voters say the state budget situation is at least somewhat of a problem; four in ten adults (42%) and about half of likely voters (48%) say it is a big problem (somewhat of a problem: 49% adults, 45% likely voters; not a problem: 7% adults, 6% likely voters). The share of adults saying the budget situation is a big problem was similar in February (40%). Today, majorities of partisans say it is at least somewhat of a problem, but Republicans (73%) are much more likely than independents (51%) and Democrats (30%) to say it is a big problem.
Four in ten Californians say the state budget situation is a big problem

SOURCE: PPIC Statewide Surveys, 2006–2024.
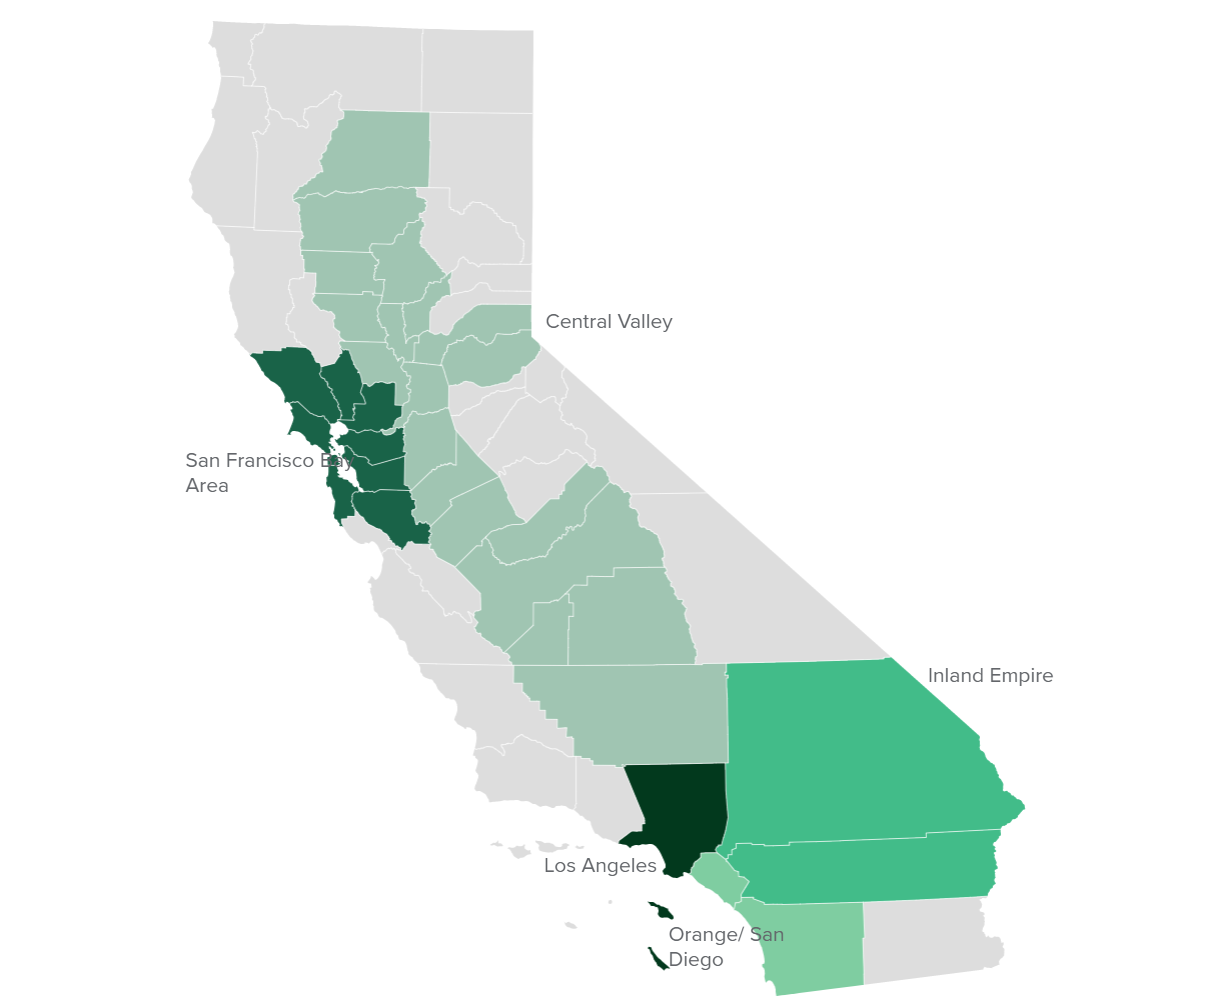
After reading a brief summary of the governor’s May Revision, majorities of adults and likely voters are in favor. The proposal includes $3 billion in efficiencies and $3.9 billion in fund shifts. Despite the projected shortfall, the plan currently includes no new taxes. In our February survey, the January budget proposal had the support of about half of Californians (51%) and likely voters (48%). Today, an overwhelming share of Democrats are in favor, while an overwhelming majority of Republicans oppose the budget plan; independents are divided. Support for the May Revision is higher in the San Francisco Bay Area (63%) and Los Angeles (58%) while fewer elsewhere hold this view (50% Orange/San Diego, 49% Central Valley, 43% Inland Empire).
A majority of Californians and likely voters favor the governor's May Revision to the state budget for the next fiscal year

SOURCE: PPIC Statewide Survey, June 2024. Survey was fielded from May 23–June 2, 2024 (n=1,677 adults and n=1,098 likely voters).
The governor’s budget plan proposes to use $4.2 billion from the state’s reserves, mostly from the Budget Stabilization Account (or Rainy Day Fund), to partially address the current budget shortfall. Forty-four percent of adults and 48 percent of likely voters think this is a good idea (adults: 51% bad idea, likely voters 49% bad idea). Democrats are far more likely than Republicans or independents to say use of reserves is a good idea; however, across regions and demographic groups, the share saying this is a good idea reaches a majority only among college graduates (52%) and those in the San Francisco Bay Area (53%).
The governor’s budget proposal also calls for a combination of cuts, delayed spending, and shifts in funding sources to help bridge the gap between spending and revenues. Currently, the plan calls for $15.2 billion in spending cuts, about $3 billion in climate program reductions, and $1 billion in housing program reductions. Californians are divided on this approach (47% good idea, 48% bad idea), while likely voters are slightly more likely to view it favorably (52% good idea, 45% bad idea).
Californians are divided on spending cuts and use of Rainy Day Fund in the governor's budget plan
% good idea

SOURCE: PPIC Statewide Survey, June 2024. Survey was fielded from May 23–June 2, 2024 (n=1,677 adults and n=1,098 likely voters).
About four in ten Californians would prefer to deal with the projected $27.6 billion budget gap mostly through spending cuts (42% adults, 47% likely voters), while another four in ten would prefer a mix of spending cuts and tax increases (40% adults, 41% likely voters). Fewer than one in ten say they would prefer tax increases or say it is okay to borrow money and run a budget deficit.
Forty-three percent of adults say health and human services should be the highest priority for state government spending while 40 percent choose K–12 public education; fewer choose higher education (8%) or prisons and corrections (7%).
Regarding overall preferences on taxes and spending, most Californians (56%) would prefer to pay lower taxes and have a state government that provides fewer services; 42 percent would rather pay higher taxes and have more services. Today, most adults across parties, regions, and demographic groups prefer a smaller government.
In recent years, several legislative proposals have been put forward that would increase taxes on the rich and on corporations. When asked about such tax increases that could be used to help reduce the state’s budget gap, most Californians and likely voters are in favor. Two in three Californians (66%) and likely voters (69%) support raising the top rate of the state income tax paid by the wealthiest Californians. Support is even higher for raising the state taxes paid by some of the largest California corporations (70% all adults, 71% likely voters).
When asked about 1978’s Proposition 13—the ballot measure that limits the property tax rate to 1 percent of assessed value at time of purchase and annual tax increases to no more than 2 percent until the property is sold—65 percent say it’s mostly been a good thing and 30 percent say it’s mostly been a bad thing.
State of the State
Over a third of Californians see the cost of living, economy, and inflation (36%) as the most important issue facing California today. Fewer mention housing costs and availability (19%), homelessness (13%), crime and drugs (7%), and government in general (5%). Likely voters express similar sentiments.
Across partisan groups, a third or more name cost of living, economy, and inflation as the top issue, with housing costs mentioned the second most often. Democrats (22%) and independents (20%), however, are more likely say housing than Republicans (11%). One in ten Republicans name government in general as the top issue; it is the third most common response among Republicans. Meanwhile, Democrats (17%) and independents (13%) are more concerned about homelessness (Republicans: 8%).
Majorities of California adults (62%) and likely voters (59%) continue to think that things in the state are headed in the wrong direction, a share that has slowly grown in the last year (June 2023: 54% wrong direction, 45% right direction). Overwhelming shares of Republicans (90%) and independents (76%) think things are going in the wrong direction, compared a much smaller share of Democrats (37%). Majorities across regions and demographic groups hold this pessimistic view, with the highest shares being among residents with a high school diploma or less education (68%) and those making less than $40,000 (67%).
Six in ten Californians say the state is going in the wrong direction

SOURCE: PPIC Statewide Surveys, 1998–2024.
Close to seven in ten (68%) expect bad economic times in the next year—similar to the last two years (69% bad times in June 2023; 68% in July 2022). Overwhelming majorities of Republicans (85%) and independents (76%) hold this pessimistic view, compared to about half of Democrats (51%). Majorities across regions and demographic groups expect bad times. Pessimism is highest in the Central Valley and Orange/San Diego (72% each) and lowest in the San Francisco Bay Area (59%). Strong majorities of whites (71%), Latinos (69%), and Asian Americans (65%) are pessimistic, compared to a smaller share of African Americans (56%). Three in four residents earning less than $80,000 (74%) say they expect bad economic bad times, a share that is higher than those with incomes over $80,000 (63%).
Most Californians continue to expect bad financial times over the next year

SOURCE: PPIC Statewide Surveys, 1999–2024.
More than a third of Californians (36%) say their personal financial situation is worse off than it was a year ago, while about half say it is about the same and 16 percent say they are better off. A majority of Republicans (51%) say their financial situation is worse off, compared to lower shares of independents (43%) and Democrats (23%). Residents with incomes under $40,000 (48%) are much more likely than residents earning more than $80,000 (30%) to say their personal financial situation is worse than a year ago. Relatedly, about a third (35%) say they are not satisfied with their financial situation; about half are somewhat satisfied (48%) and few are very satisfied (16%). More than a third across regions of the state are not satisfied, with the exception of those in the San Francisco Bay area (27%). Adults ages 18 to 34 (41%) are more likely than those 55 and over (27%) to be unsatisfied with their financial situation.
A majority of Californians say the cost of housing places at least a little financial strain on them and their families (29% a lot, 24% a little). This sense of strain is highest among residents in Los Angeles (56%) and lowest in the San Francisco Bay Area (49%). Among demographic groups, residents earning less than $40,000 (74%) and those without at least some college education (67%), Latinos (64%), and 18- to 34-year-olds (64%) are the most likely to report at least some financial strain. Renters (72%) are almost twice as likely than homeowners (37%) to say this.
After May’s budget revision, majorities of adults (54%) and likely voters (52%) disapprove of the way Gavin Newsom is handling his job as governor, while fewer approve (44% adults and 47% likely voters). The share of both adults and likely voters disapproving of the governor has steadily increased since last June (43% disapprove among each) and first reached 50 percent this February. Seven in ten Democrats approve, while close to nine in ten Republicans disapprove; independents are twice as likely to disapprove than approve (66% to 32%). Majorities of residents across regions disapprove of Newsom as do majorities across demographic groups—with the exception of African Americans and college graduates.
Californians also disapprove of the state legislature and the legislators representing their own assembly and senate districts, with a majority of adults and likely voters disapproving and about four in ten each approving. More than six in ten Democrats approve of both the legislature and their own legislators, while solid majorities of Republicans and independents disapprove. Majorities across regions of the state disapprove of both, with the highest disapproval in the Central Valley and Orange/San Diego.
Less than half approve of Newsom, the California legislature, and their own legislators
% approving of

SOURCE: PPIC Statewide Survey, June 2024. Survey was fielded from May 23–June 2, 2024 (n=1,677 adults and n=1,098 likely voters).
State of the Nation
When asked to name the most important problem facing the United States, about a quarter of California adults name the cost of living, the economy, and inflation (26%) as the most important problem; about two in ten named government in general, elected officials, and political parties (19%); and 10 percent mention immigration. Fewer mention crime and drugs (6%); democracy and elections (5%); homelessness (5%); or housing costs and availability (5%). Likely voters say that government in general (24%) or cost of living, economy, and inflation (23%) are top issues for the country.
Among partisans, Republicans (25%) are far more likely than Democrats (4%) and independents (7%) to say the top issue is immigration; however, somewhat similar shares across these groups say that the top issue is government in general (25% independents, 23% Republicans, 19% Democrats) or cost of living, the economy, and inflation (26% Republicans, 25% independents, 24% Democrats).
Three in four California adults (75%) and likely voters (74%) say the United States is going in the wrong direction, a share that has been rising since May 2021 (43%), when the country was in the midst of the COVID-19 pandemic. In fact, the share saying things are going in the right direction (23%) has not been this low since August 2008, when 21 percent said this. Today, partisans are pessimistic, with most Democrats (62%), Republicans (93%), and independents (82%) saying the country is going in the wrong direction. Strong majorities across all demographic groups and regions say wrong direction, with the share saying this declining slightly as age and income increase.
The share of Californians who say the US is going in the wrong direction is rising

SOURCE: PPIC Statewide Surveys, 2003–2024.
Sixty-eight percent of adults and 62 percent of likely voters expect bad times financially in the US over the next year; fewer expect good times (29% adults, 36% likely voters). A majority of adults have expected bad economic times in the US since February 2022 (54%). Today, a majority of Democrats (52%), and most Republicans (85%) and independents (74%), say they expect bad economic times. Majorities across demographic and regional groups say this; while this view is much less prevalent in the San Francisco Bay Area than elsewhere, a majority of Bay Area residents say this. The share expecting bad economic times declines as age, education, and income rise.
Nearly seven in ten Californians expect bad economic times in the US over the next year

SOURCE: PPIC Statewide Surveys, 2003–2024.
Nearly all adults and likely voters are very (56% adults, 58% likely voters) or somewhat (35% adults, 33% likely voters) concerned about the price of food and consumer goods in the country today. Majorities across demographic, partisan, and regional groups are very concerned, with the exception of Asian Americans (50%), adults earning $80,000 or more (49%), college graduates (48%), Democrats (47%), and San Francisco Bay Area residents (45%).
With the November election coming up soon, and amid criticism of President Biden’s handling of the Middle East and other policy domains, a majority of California adults disapprove (56%) of the job that he is doing as president of the United States (42% approve), while likely voters are more divided (50% approve, 49% disapprove). Approval among adults are identical to findings in February of this year.
Eight in ten or more adults (79%) and likely voters (83%) disapprove of the way the US Congress is handling its job, while about two in ten or fewer approve (19% adults, 15% likely voters). Approval among adults was similar in February, and has never been over 50 percent since PPIC first asked this question in 2005.
When it comes to their own representative in the US House of Representatives, six in ten adults (61%) and 57 percent of likely voters disapprove (approve: 36% adults, 42% likely voters). Compared to a year ago, the shares expressing disapproval have increased 14 percentage points among both adults and likely voters (June 2023: 47% adults, 43% likely voters). Today, Californians are more approving of representatives in Democratic districts (38%) than those in Republican districts (26%).
Fewer than half approve of the way that President Biden, US Congress, and their own US House representatives are handling their jobs
% approving of . . .

SOURCE: PPIC Statewide Survey, June 2024. Survey was fielded from May 23–June 2, 2024 (n=1,677 adults and n=1,098 likely voters).

Topics
2024 Election COVID-19 Health & Safety Net Political Landscape Statewide Survey