Key Findings
The general election season is in high gear after an eventful summer capped by a late change at the top of the ticket with implications for close presidential and congressional races. The California ballot includes 10 state propositions—five legislative measures and five citizens’ initiatives—after a record-setting seven ballot initiatives were withdrawn or removed in late June. The 2023–24 legislative session concluded with a flurry of bills sent to Governor Newsom to sign or veto in September. Slowdowns in inflation and job growth have set the stage for potential interest rate cuts.
These are the key findings of the Californians and Their Government survey on state and national issues, conducted August 29–September 9, 2024:
 Kamala Harris and Tim Walz (D) lead Donald Trump and J.D. Vance (R) by a 31 point margin (60% to 29%) in the presidential race; 56 percent of California likely voters are satisfied with the choice of candidates. Joe Biden was also leading Donald Trump by a wide margin, but far fewer Californians were satisfied with the choice of presidential candidates. Adam Schiff (D) leads Steve Garvey (R) by 28 points (63% to 35%) in the US Senate race, a margin that has not changed much since the March primary; 59 percent say they are satisfied with the choice of candidates. Democratic candidates lead Republican candidates in local House district races by a 26 point margin (62% to 36%); 52 percent say they are more enthusiastic than usual about voting for Congress this year. →
- Proposition 36 (increasing crime sentences) currently leads in terms of support, interest, and importance among the 10 state propositions. Seventy-one percent say they would vote “yes” on Proposition 36, and 41 percent say the outcome of this vote is very important. More than six in ten would vote yes on Proposition 3 (right to marriage), Proposition 4 (climate bond), and Proposition 35 (Medi-Cal funding), half or more would vote yes on Proposition 2 (education bonds), Proposition 32 (higher minimum wage), Proposition 33 (expanding local rent controls), and Proposition 34 (restricting spending on prescription drug revenues), while less than half would vote yes on Proposition 5 (55% to pass local bonds) and Proposition 6 (eliminating involuntary servitude for incarcerated persons). →
- Majorities of adults and likely voters think the state is headed in the wrong direction and expect the state to have bad times financially in the next 12 months. About half say that they are “somewhat” satisfied with their household’s financial situation and expect their personal financial situation to be “about the same” six months from now. Forty-nine percent of adults and 51 percent of likely voters approve of the way that Governor Gavin Newsom is handling his job, while 47 percent of adults and 48 percent of likely voters approve of the state legislature. Majorities of adults and likely voters say that they can trust the state government to do what is right “only some of the time,” and about seven in ten think it is “pretty much run by a few big interests.” →
 Majorities of adults and likely voters think the nation is generally going in the wrong direction and expect bad times financially in the next 12 months. Forty-eight percent of adults and 55 percent of likely voters approve of President Joe Biden’s job performance, and 53 percent of adults and 56 percent of likely voters approve of Vice President Kamala Harris’s job performance. Less than a quarter say that they approve of the US Congress. Strong majorities of Californians and likely voters say that they can trust the federal government to do what is right “only some of the time,” and about eight in ten think it is “pretty much run by a few big interests.” About seven in ten would support a change from the Electoral College system to a direct popular vote for president. →
November Election
California’s November ballot includes the presidential race at the top of the ticket. Voters will also be electing a US Senator and 52 US House members. The competitive House races that may determine the party in control of a closely divided Congress are being carefully watched. There are ten state propositions—five legislative ballot measures and five citizens’ initiatives.
After an eventful summer, how are California likely voters responding to the ballot items this fall? Sixty-nine percent say they are “more interested” in politics this year than in 2020 (29% less; 2% same). Democrats (76%) are more likely than Republicans (67%) and independents (59%) to say that they are more interested this year than they were four years ago. Six in ten or more across demographic groups and regions of the state say that they are more interested in politics this year than in 2020.
US presidential race. The presidential race was upended when President Joe Biden announced an end to his candidacy this summer. Vice President Harris was chosen to replace him and named Governor Tim Walz as her running mate before the Democratic convention. Former president Donald Trump named Senator J.D. Vance as his running mate before the Republican convention. While national polls indicate a close race, California likely voters would choose Kamala Harris and Tim Walz (D) over Donald Trump and J.D. Vance (R) by a wide margin (60% to 29%; note: data collection for this survey ended on the day before the September 10 presidential debate).
Californians’ support for the Democratic presidential candidate—and partisans’ overwhelming preference for their party’s candidates—were the consistent trends before Harris replaced Biden. Today, 90 percent of Democrats support Harris and 82 percent of Republicans favor Trump; independents favor Harris over Trump (57% to 24%). Harris leads Trump across age, education, gender, income, and racial/ethnic groups as well as the state’s major regions. Nine percent would vote for a third-party ticket or “someone else,” including 6 percent of Democrats, 7 percent of Republicans, and 13 percent of independents. Few are undecided about the presidential race.
Fifty-six percent of likely voters say they are satisfied with the choice of candidates in the election for president in 2024. When we asked this question in April, when the presidential race was Biden versus Trump, just 36 percent said that they were satisfied. Today, half or more across partisan and demographic groups as well as state regions say that they are satisfied with the choice of candidates. Democrats (69%) are much more likely than Republicans (55%) and independents (37%), and Harris supporters (66%) are much more likely than Trump supporters (54%), to say they are satisfied.
Six in ten California likely voters support the Democratic presidential ticket

SOURCE: PPIC Statewide Survey, September 2024. Survey was fielded August 29–September 9, 2024 (n=1,605 adults, n=1,071 likely voters).
NOTES: Among likely voters only. *Other candidates includes the “someone else (specify)” response option and any candidates below the top two. All Certified Presidential candidates on the California general election ballot were included in the question.
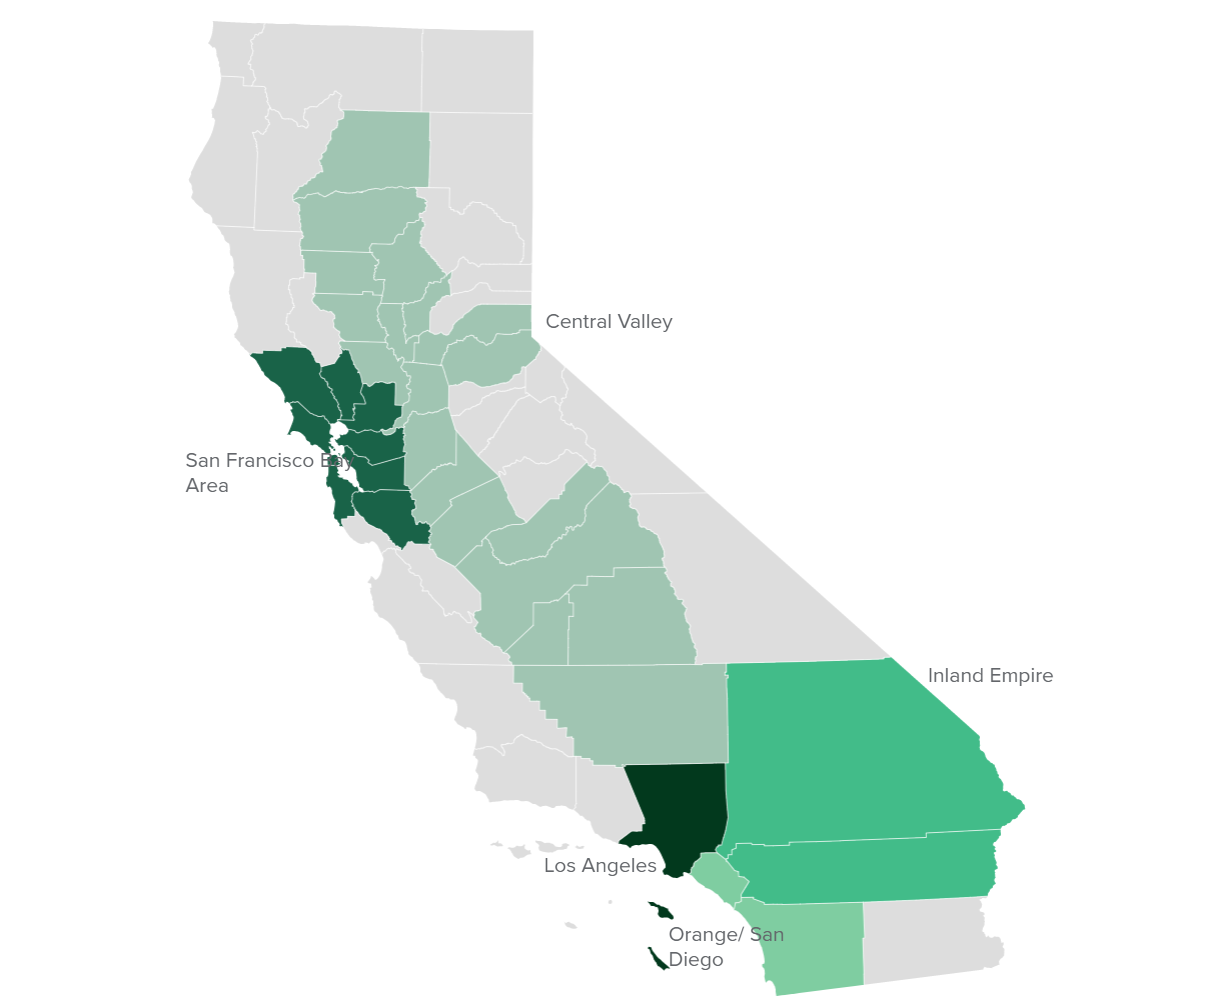
US Senate race. Adam Schiff (D) is favored over Steve Garvey (R) by a wide margin (63% to 35%) in the US Senate election in California. Results have been similar in polling after the March primary. Today, 93 percent of Democrats favor Schiff and 90 percent of Republicans favor Garvey, while independents are more divided (60% Schiff, 37% Garvey). Schiff has more support than Garvey across demographic groups and in the Inland Empire, Los Angeles, Orange/San Diego, and the San Francisco Bay Area, while the Central Valley is evenly divided (48% Schiff, 48% Garvey).
Fifty-nine percent of likely voters are satisfied with the choice of candidates in the Senate election. Today, majorities across demographic groups and regions say that they are satisfied with the choice of candidates. Satisfaction has been similar after the March primary. Democrats (68%) are more likely than Republicans (59%) and independents (44%) and Schiff supporters (64%) are more likely than Garvey supporters (53%) to say they are satisfied.
A solid majority of California likely voters would vote for Adam Schiff if the Senate election were held today

SOURCE: PPIC Statewide Survey, September 2024. Survey was fielded August 29–September 9, 2024 (n=1,605 adults, n=1,071 likely voters).
NOTES: Among likely voters only.
US House races. Likely voters would choose their local Democratic candidate over the Republican by a wide margin (62% to 36%) if the election were today. The results have been similar in polling after the March primary. Today, in the 10 competitive districts (as defined by the Cook Political Report), the margin is narrower (55% for the Democrat, 41% for the Republican). Over nine in ten Democratic and Republican likely voters would choose their party’s candidate, while independents are more divided (56% for the Democrat, 39% for the Republican). Majorities favor the Democratic candidate over the Republican across demographic groups and in the Inland Empire, Los Angeles, Orange/San Diego, and the San Francisco Bay Area. In the Central Valley, likely voters are more divided (51% for the Republican, 46% for the Democrat).
Fifty-two percent of likely voters say they are more enthusiastic than usual about voting for Congress this year, compared to other years. By comparison, 47 percent were more enthusiastic last December. Today, Democrats (62%) and those supporting Democratic candidates (61%) are more likely than Republicans (46%) and those supporting Republican candidates (39%) to hold this view. In the competitive House races, 55 percent are more enthusiastic about voting for Congress this year (43% less enthusiastic).
State ballot initiatives. Likely voters were asked for their general perceptions about California’s direct democracy system after being presented with the 10 state propositions on the November ballot. (Note: voter support for each measure is summarized in the next section.) Overall, 79 percent think it is a good thing that a majority of voters can make laws and change public policies by passing initiatives, and 87 percent agree that initiatives “bring up important public policy issues that the governor and legislature have not adequately addressed.” However, 69 percent agree that there are “too many initiatives on the ballot” and 87 percent agree that the ballot wording is “often too complicated and confusing for voters.” There is consensus across partisan and demographic groups and state regions about these perceptions of state ballot initiatives. Forty-nine percent think that the initiative process in California today is controlled “a lot” by special interests, while partisans differ in their perceptions (41% Democrats, 62% Republicans, 53% independents). Sixty percent say that they are “somewhat satisfied” with the information that is available to voters about citizens’ initiatives on the state ballot. Overwhelming majorities say they are in favor of having the yes and no side of initiative campaigns participate in town halls (79%) and televised debates (79%), as well as having an independent citizens’ initiative review commission (70%).
A solid majority of California likely voters would vote for the Democratic candidate if the 2024 election for the House of Representatives were held today

SOURCE: PPIC Statewide Survey, September 2024. Survey was fielded August 29–September 9, 2024 (n=1,605 adults, n=1,071 likely voters).
NOTES: Among likely voters only.
State Propositions
With five citizens’ initiatives and five legislative constitutional amendments on the November 5 state ballot, we asked likely voters which one they are most interested in. About one in four likely voters (26%) say they are most interested in Proposition 36, a citizens’ initiative (Allows Felony Charges and Increases Sentences for Certain Drug and Theft Crimes); each of the other nine state propositions had far fewer mentions. Proposition 36 is receiving the most support, followed closely by Proposition 3 (Constitutional Right to Marriage).
After reading the Proposition 36 ballot title and label, 71 percent of likely voters say they would vote yes, while 26 percent would vote no. There is broad—and bipartisan—support for Proposition 36. Regionally, support is highest in the Inland Empire (79%) and lowest in the San Francisco Bay Area (64%, 74% Orange/San Diego, 73% Central Valley, 71% Los Angeles). When asked how important the outcome of the vote on Proposition 36 is, three in four likely voters say it is very (41%) or somewhat important (36%). Those who would vote yes on the measure are three times more likely than those who would vote no to call it very important (51% to 16%).
A solid majority would vote yes on Proposition 36, which would allow felony charges and increased sentences for some drug and theft crimes

SOURCE: PPIC Statewide Survey, September 2024. Survey was fielded August 29–September 9, 2024 (n=1,605 adults, n=1,071 likely voters).
NOTES: Likely voters only.
We also asked about Proposition 3 (Constitutional Right to Marriage), a legislative constitutional amendment. After reading the ballot title and label, 68 percent of likely voters say they would vote yes, while 31 percent say they would vote no. Strong majorities of Democrats and independents would vote yes, compared to fewer than four in ten Republicans. Support is highest among residents in the San Francisco Bay Area (81%), followed by those in Los Angeles (70%), Orange/San Diego (67%), the Inland Empire (62%), and the Central Valley (57%). Majorities across demographic groups would vote yes, although support increases with higher educational attainment and income and is lower among those 45 and older compared to those 18 to 44. When asked how important the outcome of the vote on Proposition 3 is, about two in three likely voters say it is very (37%) or somewhat important (31%). Similar shares of those who would vote yes (39%) and those who would vote no (33%) say the outcome of Proposition 3 is very important.
Most likely voters support Proposition 3, which would enshrine marriage rights in the state constitution

SOURCE: PPIC Statewide Survey, September 2024. Survey was fielded August 29–September 9, 2024 (n=1,605 adults, n=1,071 likely voters).
NOTES: Likely voters only.
Both of the $10 billion bonds placed on the November ballot by the state legislature receive majority support at this time. After reading the ballot title and label, 54 percent of likely voters say they would vote yes on Proposition 2 (Authorizes Bonds for Public School and Community College Facilities); 44 percent would vote no. Seventy-four percent of Democrats would vote yes, compared to 48 percent of independents and just 22 percent of Republicans. There is majority support across regions; support is higher among younger, more educated, and less affluent likely voters. When asked to rate the importance of the outcome of the vote on Proposition 2, 19 percent say it is very important and 49 percent say it is somewhat important. Similar shares of those who would vote yes (21%) and those who would vote no (16%) say the outcome of Proposition 2 is very important.
The second bond measure—Proposition 4 (Authorizes Bonds for Safe Drinking Water, Wildfire Prevention, and Protecting Communities and Natural Lands from Climate Risks)—receives more support. After reading the ballot title and label, 65 percent of likely voters would vote yes (33% no). Partisans are deeply divided, with 83 percent of Democrats and 64 percent of independents in support compared to 35 percent of Republicans. Across regions and demographic groups, majorities of likely voters would vote yes. Three in four likely voters say the outcome of Proposition 4 is very (32%) or somewhat important (43%). Those who would vote yes on the measure are far more likely than those who would vote no to call it very important (42% to 15%).
We also gauged support for six other state propositions that will be on the November ballot:
- Proposition 5 (Allows Local Bonds for Affordable Housing and Public Infrastructure with 55% Voter Approval). Likely voters are divided on this legislative constitutional amendment, with 49 percent saying they would vote yes and 50 percent saying they would vote no.
- Proposition 6 (Eliminates Constitutional Provision Allowing Involuntary Servitude for Incarcerated Persons). Likely voters are slightly more likely to say they would vote no (50%) than yes (46%) on this legislative constitutional amendment.
- Proposition 32 (Raises Minimum Wage). Likely voters are divided on this citizens’ initiative, with 50 percent saying they would vote yes and 49 percent saying they would vote no.
- Proposition 33 (Expands Local Governments’ Authority to Enact Rent Control on Residential Property). Likely voters are slightly more likely to say they would vote yes (51%) than no (46%) on this citizens’ initiative.
- Proposition 34 (Restricts Spending of Prescription Drug Revenues by Certain Health Care Providers). A slim majority of likely voters would vote yes (53%) on this citizens’ initiative, while 43 percent would vote no.
- Proposition 35 (Provides Permanent Funding for Medi-Cal Health Care Services). A solid majority of likely voters would vote yes (63%) on this citizens’ initiative, while one in three would vote no (34%).
Support varies for Propositions 2 and 4, which would issue $10 billion bonds for school facilities and climate resiliency
% voting yes

SOURCE: PPIC Statewide Survey, September 2024. Survey was fielded August 29–September 9, 2024 (n=1,605 adults, n=1,071 likely voters).
NOTES: Among likely voters only.
State of the State
About half of adults (49%) and likely voters (51%) approve of Governor Newsom’s job performance (48% disapprove among both adults and likely voters). This is the highest the governor’s approval has been in 2024. An overwhelming share of Democrats (74%) approve, while a majority of independents (54%) and nearly nine in ten Republicans (88%) disapprove. Approval varies across regions, with majorities of residents in the San Francisco Bay Area (58%) and Los Angeles (52%) approving, while half or more in other regions disapprove (57% Central Valley; 50% Orange/San Diego and Inland Empire). Majorities across racial and ethnic groups approve, with the exception of whites (41%). College graduates (54%) are more likely than non-college graduates (46%) to approve.
Forty-seven percent of Californians approve of the California legislature, while 50 percent disapprove (likely voters: 48% approve, 50% disapprove). This is the highest approval level for the state legislature in 2024. Approval of the legislature only reaches a majority among Democrats, residents in Los Angeles and the San Francisco Bay Area, Asian Americans, young adults, and college graduates.
A majority of adults (57%) and likely voters (56%) say they trust the state government to do what is right “only some of the time”; fewer say “just about always” (5% adults, 6% likely voters) or “most of the time” (37% adults, 38% likely voters). Across parties, a majority of Democrats trust the state government at least most of the time, while two in three independents and nine in ten Republicans do so only some of the time. Across regions, trust in the state government to do what is right most of the time or just about always only reaches half in the San Francisco Bay Area.
Relatedly, about seven in ten adults (71%) and likely voters (68%) say the state government is run by a few big interests; far fewer say it is run for the benefit of all people (27% adults, 30% likely voters). Majorities across parties, regions, and demographic groups hold this view. Moreover, about half of adults (48%) and likely voters (49%) say people in the state government waste a lot of the money we pay in taxes.
Close to half approve of Governor Newsom and the state legislature
% approve

SOURCE: PPIC Statewide Surveys, 2019–2024.
Majorities of California adults (55%) and likely voters (53%) continue to say that things in the state are headed in the wrong direction. The share saying the state is going in the wrong direction was slightly higher a few months ago (62% June 2024), while views from last September were similar (44% right direction, 55% wrong direction). Overwhelming shares of Republicans (91%) and 63 percent of independents think things are going in the wrong direction, compared to just one in three Democrats (32%). Half or more across most regions and demographic groups hold a pessimistic view, with the exception of San Francisco Bay Area residents (46%).
A majority of Californians say the state is going in the wrong direction

SOURCE: PPIC Statewide Surveys, 1999–2024.
Roughly six in ten Californians expect bad economic times in the next year. This finding was similar a year ago (37% good times, 62% bad times), and a majority of Californians have had a pessimistic economic outlook since November 2021 (47% good times, 52% bad times). Partisans are divided: nearly all Republicans (87%) and two in three independents (65%) are pessimistic, compared to fewer than half of Democrats (43%). Majorities across regions and demographic groups expect bad times, with the exception of African Americans (50%).
Californians hold slightly more positive views of their personal finances over the next six months. A majority (53%) expect their financial situation to be about the same, while close to a quarter expect it to be stronger (5% much stronger, 18% somewhat stronger) and about another quarter expect it to be weaker (16% somewhat weaker, 7% much weaker). Perceptions were nearly identical a year ago. Today, African Americans (17% much stronger, 19% somewhat stronger) are much more likely than other racial/ethnic groups to expect a stronger financial situation in six months. The share expecting their financial situation to be about the same rises with increasing age, education, and income.
Half of Californians (50%) are somewhat satisfied with their household’s current financial situation, while about a fifth (18%) say they are very satisfied. Conversely, about a third (32%) are unsatisfied. Republicans (36%) are more likely than Democrats (24%) and independents (27%) to be unsatisfied with their personal finances. Across regions, residents in the Central Valley (42%) and the Inland Empire (39%) are most likely to be dissatisfied (33% Los Angeles, 28% Orange/San Diego, 21% San Francisco Bay Area). A majority (53%) of residents earning $40,000 or less are dissatisfied, compared to much smaller shares of residents earning more (37% $40,000 to $79,999, 17% $80,000 or more).
Across most demographic groups, majorities say they expect bad economic times in the next year

SOURCE: PPIC Statewide Survey, September 2024. Survey was fielded August 29–September 9, 2024 (n=1,605 adults, n=1,071 likely voters).
State of the Nation
More than a month after Joe Biden dropped out of the 2024 presidential race, about half of adults (48%) and a majority of likely voters (55%) approve of the way he is handling his job as president of the United States (disapprove: 51% adults, 45% likely voters). In June, a majority of adults (56%) also expressed disapproval. Today, most Democrats approve (74%), while nine in ten Republicans (91%) and 53 percent of independents disapprove. Approval reaches a majority among African Americans (56%), Asian Americans (54%), college graduates (57%), adults earning $80,000 or more (54%), and adults under 55 (51%). A solid majority of residents in the San Francisco Bay Area (62%) approve, compared to fewer than half in other regions. Californians are about as likely as adults nationwide (43%) to approve, according to an August 2024 Gallup poll.
A majority of adults (53%) and likely voters (56%) approve of the way Kamala Harris—now the Democratic nominee for president—is handling her job as vice president (44% of adults and likely voters disapprove). Eight in ten Democrats (79%) approve, while nine in ten Republicans (89%) disapprove and independents are more divided (46% approve, 49% disapprove). A slim majority (51%) of Californians in competitive congressional districts approve of Vice President Harris (46% disapprove). Compared to Californians, adults nationwide are more divided, according to Gallup (47% approve, 49% disapprove).
About half of adults (49%) and a majority of likely voters (54%) approve of Senator Alex Padilla (43% adults and 40% likely voters disapprove); these shares have been somewhat similar since June 2023.
Majorities disapprove of Speaker of the House Mike Johnson (58% adults, 62% likely voters); 34 percent of adults and likely voters disapprove. Results were similar in December 2023, the only other time we asked this question.
When it comes to the US Congress, overwhelming majorities of adults (71%) and likely voters (78%) disapprove; 23 percent of adults and 20 percent of likely voters express approval. Seven in ten or more have disapproved of Congress since February 2023. Californians are about as likely as adults nationwide to disapprove (76%), according to Gallup.
Nearly half approve of President Biden, while nearly a quarter approve of US Congress
% approve

SOURCE: PPIC Statewide Surveys, 2021–2024.
Majorities of adults (61%) and likely voters (54%) expect bad financial times during the next 12 months; 36 percent of adults and 43 percent of likely voters expect good times. The share of adults saying they expect bad times has declined somewhat since June (68%). Today, a majority of Democrats (54%) expect good financial times, while most Republicans (81%) and independents (64%) expect bad times. Majorities across demographic groups expect bad times, with the exception of African Americans, who are divided (46% good times, 48% bad times).
A solid majority of Californians continue to expect bad economic times in the US

SOURCE: PPIC Statewide Surveys, 2003–2024.
Overwhelming majorities of adults (71%) and likely voters (70%) say things in the country are generally going in the wrong direction; fewer than one in three say things are going in the right direction (27% adults, 28% likely voters). A majority of adults have said things are headed in the wrong direction since February 2022 (56%). Today, majorities across partisan groups say things are headed in the wrong direction, as do about two in three or more across demographic and regional groups.
When it comes to trust in the federal government, just three in ten adults say they can trust it to do what is right just about always (4%) or most of the time (27%); two in three adults (67%) say they can only trust it some of the time, and 1% volunteered the answer none of the time. Majorities across parties say they can trust the federal government only some of the time.
More than eight in ten adults (82%) and likely voters (84%) say the federal government is run by a few big interests looking out for themselves, and majorities (56% adults, 58% likely voters) say the federal government wastes a lot of the tax money people pay.
In the midst of a close presidential race that may be decided by several swing states, seven in ten adults (69%) and likely voters (70%) would support changing to a system in which the president is elected by direct popular vote, instead of by the Electoral College; 28% of adults and likely voters are opposed to this change. Solid majorities have been in favor of this change in periodic surveys since PPIC first asked the question in January 2001.
Most Californians say things in the US are going in the wrong direction

SOURCE: PPIC Statewide Survey, September 2024. Survey was fielded from August 29–September 9, 2024 (n=1,605 adults, n=1,071 likely voters).

Topics
2024 Election Criminal Justice Health & Safety Net Political Landscape Statewide Survey