Table of Contents
- Key Takeaways
- Introduction
- College Enrollment and Completion Have Long Trended Upward
- Our Projections Suggest Enrollment Increases up to 2035
- California’s Public Systems Plan to Increase Enrollment—but Face Capacity and Funding Constraints
- Implications for the Future
- Notes and References
- Authors and Acknowledgments
- PPIC Board of Directors
- Copyright
Key Takeaways
Higher education has long been a driver of economic mobility and well-being in California. In recent years, declines in the number of young adults led to falling enrollment at many colleges and universities across the country, but not at most of California’s higher education institutions. During the pandemic, however, the state population dropped and higher education enrollment declined. How will California’s colleges and universities fare in the future? In this report, we extrapolate from current trends in order to project undergraduate enrollment in California over the next two decades. We find that:
- Enrollment in higher education will increase slightly over the next decade. Declines in the number of young adults of prime college-going ages will be offset by rising rates of college-going. We expect college-going rates to resume the upward trajectory that we observed prior to the pandemic. This will help mitigate the effect of demographic changes. →
- To a large extent, increases in college participation will be driven by increases in the share of high school graduates who complete the college prep courses (the A–G requirement) required to be considered for admission at the University of California (UC) and California State University (CSU).
- Community colleges are likely to face bigger enrollment challenges than the state’s four-year colleges and universities. Our projections suggest that community colleges will see little growth in enrollment after recovering from pandemic losses. UC is projected to have robust growth, while CSU and private nonprofit colleges will see modest growth.
- Increases in college participation among Latinos will help narrow racial/ethnic gaps in college enrollment and completion. By 2035, Latinos will make up about half of students at CSU and the community colleges. Asian students will remain the largest group at UC, and white students will remain the largest group at private nonprofit colleges.
- California has a long track record of public investment in higher education that has allowed for large enrollment increases. Bonds to pay for infrastructure, whether it is online capacity or brick and mortar classrooms, will be necessary to realize the projected enrollment increases. The last state bond to fund higher education infrastructure was passed in 2006. →
- These increases in enrollment will help the state reach its goal of 40 percent of working-age adults with bachelor’s degrees by 2035. However, this goal is reachable largely because a substantial share of people who moved to California have bachelor’s degrees (57% of 25- to 54-year-olds). In contrast, only 35 percent of California-born young adults have a bachelor’s degree. A focus on increasing college completion among young Californians would improve educational mobility—and help close equity gaps in the state’s higher education systems.
Introduction
California has long thought of itself as a leader in higher education. The state’s innovative Master Plan for Higher Education was established in 1960 with the aim of providing postsecondary opportunities for “anyone who could benefit.” The plan both anticipated and led to a tremendous increase in higher education enrollment and completion. New campuses were built and existing campuses were expanded. In 1960, 227,000 young adults (16% of all 18- to 24-year-olds) were either enrolled in college or had earned a degree; that number had almost quadrupled to 877,000 (27%) by 1980.
The Master Plan was quite ambitious: at a time when only 11 percent of adults of prime working age (25 to 54) had bachelor’s degrees, the plan made the top eighth (or 12.5%) of high school graduates eligible for the University of California (UC) system, and the top third (33%) eligible for the California State University (CSU) system. Additional spaces were to be reserved for students transferring from the state’s community colleges.
But by the beginning of this century, it was clear that California’s Master Plan was out of date. The share of adults of prime working age with at least a bachelor’s degree reached 37 percent in 2021. And even as a college degree became more common, its advantages grew. Today, workers with college degrees have near-record low levels of unemployment, enjoy wage premiums at or near record levels, and have jobs with more benefits than less-educated workers (Cuellar Mejia et al. 2023). The demand for college graduates remains stronger than ever.
As part of an ambitious “California Blueprint,” the state recently set a goal for degree attainment: by 2030, 70 percent of working age adults (ages 25 to 64) will have a postsecondary award (30%) or a bachelor’s degree (40%). Achieving this goal will require increases in both college enrollment and persistence (graduation rates). According to the Lumina Foundation, 55 percent of working-age Californians currently have some sort of postsecondary credential (including a bachelor’s degree); 37 percent had at least a bachelor’s degree.
California’s higher education systems are pursuing this goal in a time of uncertainty. After decades of tremendous population growth, California faces an extended period of demographic stagnation. The pandemic accelerated domestic migration out of the state and slowed international migration to the state. Meanwhile, birth rates have continued their decades-long decline and are now at historic lows. That means fewer children in our K–12 system and fewer high school graduates. The California Department of Finance (DOF) projects that between 2022 and 2040 the state’s population will increase only 3 percent, and the number of 18- to 24-year-olds will decline 8 percent (with most of the losses occurring after 2035). This means that growth in college enrollment will depend on increases in college-going and persistence rates rather than increases in the number of Californians.
The good news is that California has seen increases in college-going and completion in recent years, especially at the state’s public universities: the UC and the CSU. Educators and policymakers want this trend to continue.
In this report, we project the future of higher education enrollment in California and calculate whether increases in enrollment will meet the state’s higher education goal. Our focus is on undergraduate enrollment at the state’s four major sectors of higher education: the California Community Colleges, the University of California, the California State University, and private nonprofit four-year colleges in California (See Technical Appendix A for details of our methods and data). A critical component of our analysis is a consideration of capacity plans at the state’s public colleges and universities.
It is important to note that these projections depend on a number of assumptions. We assume that pre-pandemic trends in college-going rates and persistence to graduation will resume, and that past increases in college preparation of high school graduates will continue. Most important, we assume that the state’s university systems will be able to grow to accommodate student demand. Finally, we assume that the underlying demographic forces that will shape the state’s future population are adequately captured by the California Department of Finance projections.
College Enrollment and Completion Have Long Trended Upward
Historically, California’s higher education system has experienced remarkable growth. In the last half of the 20th century, policies and investments helped the public colleges add campuses and students to match the state’s rapid population growth. California’s population growth slowed this century, but higher education enrollment and completion continued to increase as the share of high school graduates going to college grew. By 2021, the share of young California-born adults with at least a bachelor’s degree exceeded 35 percent, up from only about 20 percent in 1990 (Figure 1).
Californians are increasingly likely to earn a bachelor’s degree
Percent of California-born residents of the US with at least a bachelor's degree, 18–30 year-olds

SOURCE: Authors’ estimates based on decennial census and American Community Survey data, accessed via IPUMS based on California-born residents living anywhere in the US.
NOTES: It is not possible with existing data to calculate the historic share (back to 1990) of California K–12 students who go on to earn a bachelor’s degree. We use state of birth as a proxy measure of college completion rates among young adults who attended K–12 school in California. See Technical Appendix for more information.
It is likely that continued increases in college enrollment and completion will help California achieve its goal that 40 percent of working-age adults hold bachelor’s degrees by 2030.
However, one of the main reasons California is nearing this goal is that less-educated adults have been leaving the state in large numbers for decades, while more highly educated adults have been moving here from other states. Only 35 percent of California-born residents ages 25 to 54 have at least a bachelor’s degree, compared to 57 percent of residents who moved to California from another state (Figure 2).
California-born residents are less likely to hold college degrees than those born elsewhere
% of Californians age 25–54 with at least a bachelor's degree

SOURCE: Authors’ calculations based on ACS data accessed via IPUMS.
Indeed, young adults born in California are less likely to hold bachelor’s degrees than their counterparts in most other states (Figure 3). Eight other states currently have a mid- to late-20s baccalaureate completion rate of at least 45 percent. Massachusetts has the highest rate (56%), and New York—like California, a large and diverse state—has a rate of 47 percent. This suggests that California’s 40 percent baccalaureate goal is too modest.
Californians in their late 20s are less likely to have bachelor’s degrees than their peers in most other states
Share of 25–29 year-olds with a bachelor's degree, by state of birth

SOURCE: Author calculations based on 2021 American Community Survey data accessed via IPUMS.
However, there is some reason for optimism. Californians have high educational aspirations: according to the PPIC Statewide Survey, 68 percent of parents hope their child will earn at least a bachelor’s degree. And college enrollment has been increasing in recent years (Baldassare et al. 2024).
Recent Enrollment Trends Have Varied across Education Segments
Over the past ten years, the number of high school graduates has changed very little—it has increased from 411,000 in 2010–11 to 418,000 in 2020–21. But the share of graduates who complete the college preparation courses required for admission to UC and CSU (known as the A–G requirement) has grown from just over a third (37%) to over half (52%). That translates into a sharp increase in the number of college-prepared students (Figure 4) and substantial increases in college enrollment. The number of undergraduates enrolled in California colleges peaked at 2.4 million in 2017, up from 1.6 million in 1995.
High school graduates are more likely to have completed UC and CSU college-preparatory courses

SOURCE: Author calculations based on CDE data.
NOTE: Completion of A–G courses is a requirement for admission to UC and CSU.
But over the past few years, California’s population has declined and college enrollment has fallen (Figure 5). This decline has been uneven across higher education segments. UC has had strong increases in enrollment and applications over the past 15 years. As the most selective system in the state, UC does not admit all eligible applicants at eight of its nine campuses; the ninth campus, UC Merced, accepts eligible students that are turned away from their preferred campus. In general, highly selective colleges across the nation have avoided the enrollment challenges facing less-selective colleges.
CSU’s enrollment trends have been mixed, with impacted campuses (those that cannot accommodate all qualified applicants) experiencing strong demand and enrollment growth, while other campuses are struggling to attract students.
Private nonprofit colleges largely follow the pattern of CSU: some are struggling, while others (mostly the highly selective schools) continue to see strong demand. The state’s community colleges have seen an unprecedented decline in enrollment that began before the pandemic.
Much like trends over the past decade or so, pandemic disruptions were not equally felt across student populations and systems.
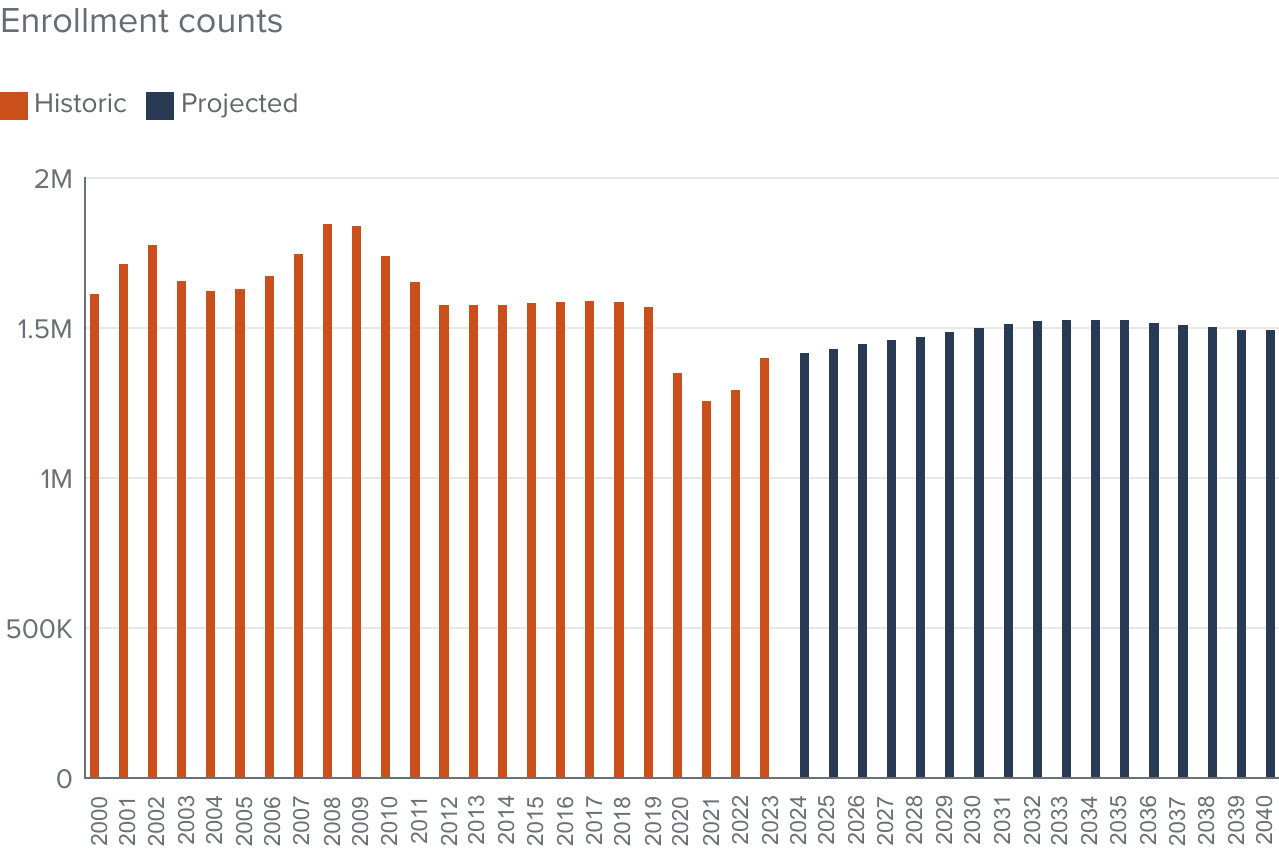
The number of undergraduates in California has declined in recent years
Number of undergraduate students in California

SOURCE: Authors’ calculations based on IPEDS, system offices, and American Community Survey data accessed via IPUMS.
NOTE: Excludes special admit students in community colleges.
The California Community Colleges, the largest postsecondary system in the country, experienced unprecedented declines in enrollment (Figure 6). For policymakers looking to increase college enrollment and graduation rates, the large losses of students aged 50 and over are not as troubling as the drop in enrollment by younger students: while older students tend to take courses for vocational or enrichment purposes, most younger students aspire to transfer to a four-year college and earn a bachelor’s degree.
Community college enrollment declines have been concentrated in younger and older age groups
Change in student enrollment at CCC from 2019–20 to 2020–21

SOURCE: Authors’ tabulations of CCCCO Data Mart tables.
NOTE: Student headcount for entire California community college system.
The state’s four-year public colleges have been less affected by the pandemic: there have been very slight declines in enrollment at private nonprofit colleges and CSU, and small increases at UC.
It is not clear how long the pandemic-induced disruptions might last. Our forecast assumes that pre-pandemic trends in college-going rates and persistence to graduation will resume, and that increases in college-going rates will offset underlying demographic forces and keep overall college enrollment from declining. Our analysis suggests that some types of colleges will fare better than others.
The key drivers of college enrollment trends are the number of young adults, their college-going rates, and their persistence in college. Changes in the number of young adults have outsized impacts on college enrollment. The overwhelming majority of college students are young adults (see Technical Appendix). And over the past 15 years almost all of the growth has occurred among young adults (18 to 24 years of age), who are at the traditional ages for college enrollment. California is projected to have little to no growth in key college-going age groups between now and 2035, and then some notable declines (Figure 7).
Population projections suggest little or no growth in key age groups
Population of key age groups

SOURCE: PPIC based on ACS estimates from 2006 to 2021 and DOF projected growth rates from 2021 to 2040.
Of particular importance are the number of high school graduates, including those who have completed the A–G requirement. Department of Finance projections suggest that the number of high school graduates will decline sharply between now and 2035. Using the same grade progression ratio model as the DOF, our extended projections show continued decline to 2040, although it is much more encouraging when we focus on A–G graduates. Our projections suggest that the number of A–G graduates will remain fairly level through the projection period.
Our Projections Suggest Enrollment Increases up to 2035
Our projections suggest that overall college enrollment in California will increase slightly to 2035 and then begin to decline. This period of slow growth comes after decades of strong increases. As noted previously, these increases were driven by both population gains—especially among young adults and recent high school graduates—and also by increases in college-going rates among young adults. Age-specific participation rates peaked in 2019, and then declined with the pandemic. Despite popular rhetoric about growth in enrollment among older Californians pursuing upskilling, we see very low rates of participation at older ages and no sign of a significant increase in college participation among Californians over the age of 30. Our projections are highly dependent on increasing participation among young adults.
We project improvement in one key area: diversity at California’s colleges will increase. In particular, we project that continued improvements in completion of the A–G coursework will lead to notable increases in the share of Latino students at UC and CSU. In contrast, the share of Black students will not change much, despite increases in college participation rates. Declining populations of young Black adults will counteract increases in participation rates. The share of white students will vary by institution, and Asian students will continue to have the highest college participation rates.
These overall enrollment projections mask variation across higher education segments. Our own projections mirror trends over the past 15 years. Each segment (UC, CSU, CCC, and private nonprofit colleges) has seen improvements in persistence, but enrollment trends are diverging.
UC Will See Moderate Enrollment Growth
As we have seen, UC has had the strongest rate of enrollment gains over the past 15 years. With continued increases in A–G completion rates, we project that demand will remain strong for UC. Moreover, the system’s nine undergraduate campuses draw students from outside their local regions and are therefore less vulnerable to local population changes.
Our projections indicate that UC will continue to see robust undergraduate enrollment growth (Figure 8). Even so, this growth will be substantially lower than growth experienced over the past 15 years. One of the underlying assumptions of the projection model is that as more students meet UC’s eligibility criteria, the university will find space to accommodate them. (And that, of course, will depend on state funding support.) In the later years of the forecast, steep declines in high school graduates and declines in community college enrollment will limit the supply of potential new students, and enrollment is projected to decline.
Asian and Pacific Islander (API) students will remain the largest racial/ethnic group at UC, according to our projections. Asian students have the highest A–G completion rates and are projected to have the highest population growth rates by the Department of Finance. The share of Asian American UC undergraduates is projected to grow from 31 percent in fall 2022 to 35 percent by fall 2040.
Latino students have made strong gains in A–G completion and UC enrollment; the share of Latino UC undergraduates is projected to grow from 27 percent to 30 percent. White students and Black students are projected to remain at 21 percent and 2 percent, respectively.
Undergraduate enrollment and diversity at UC will continue to increase

SOURCES: UCOP to 2022 and PPIC projections 2023 to 2040.
NOTES: Fall enrollment. See Technical Appendix for details.
CSU Will Experience Solid Growth
We project that CSU will see solid enrollment growth to 2035 (Figure 9). By 2030, enrollment should surpass its 2020 peak. Increased demand among first-time freshmen who have recently completed high school as well as increases in transfer students from community colleges will be enough to overcome anemic population growth and declines in the number of high school graduates. As with UC (and for the same reasons), the system will experience slight declines in enrollment from 2035 to 2040, with a small boost from improvements in persistence and graduation rates.
CSU will continue to reflect the full diversity of California’s high school graduates. Latino students will continue to grow as a share of undergraduates, making up a majority (52%) by 2040. This continued growth reflects longstanding patterns. Latino students became the single largest racial/ethnic group at CSU in 2012 (33%), and the share of Latinos grew to 47 percent by 2022. Asian and Pacific Islander students will see modest gains; the share of API students will increase from 17 percent in 2022 to 19 percent in 2040; white students will decline from 22 percent to 17 percent and Black students will decline from 4 percent to 3 percent.
Undergraduate enrollment at CSU will grow slowly


SOURCES: CSU to 2022 and PPIC projections 2023 to 2040.
NOTES: Fall enrollment. See Technical Appendix for details.
Enrollment at the CCC Will Not Recover to Pre-Pandemic Levels
After recent declines, our projections indicate that community college enrollment will experience some growth but not recover to earlier levels. The community colleges disproportionately draw high school graduates who have not met UC and CSU eligibility criteria, a group that will shrink over the next 15 years. Between 2021–22 and 2039–40, we project that the number of high school graduates who do not complete A–G coursework will decrease from 210,000 to 127,000 (a 40% decline).
Improved persistence will help keep community college enrollment from falling further. Because the vast majority of community college students do not transfer or complete their community college programs, the upside potential for enrollment gains via increases in persistence are large. The system has identified the potential to increase enrollment among 25- to 54-year-olds, noting that efforts to increase access for this group could “generate over 300,000 new students across the system.” Our projections anticipate some increases for those age groups, but nowhere near as many as the system’s “Vision 2030” goal.
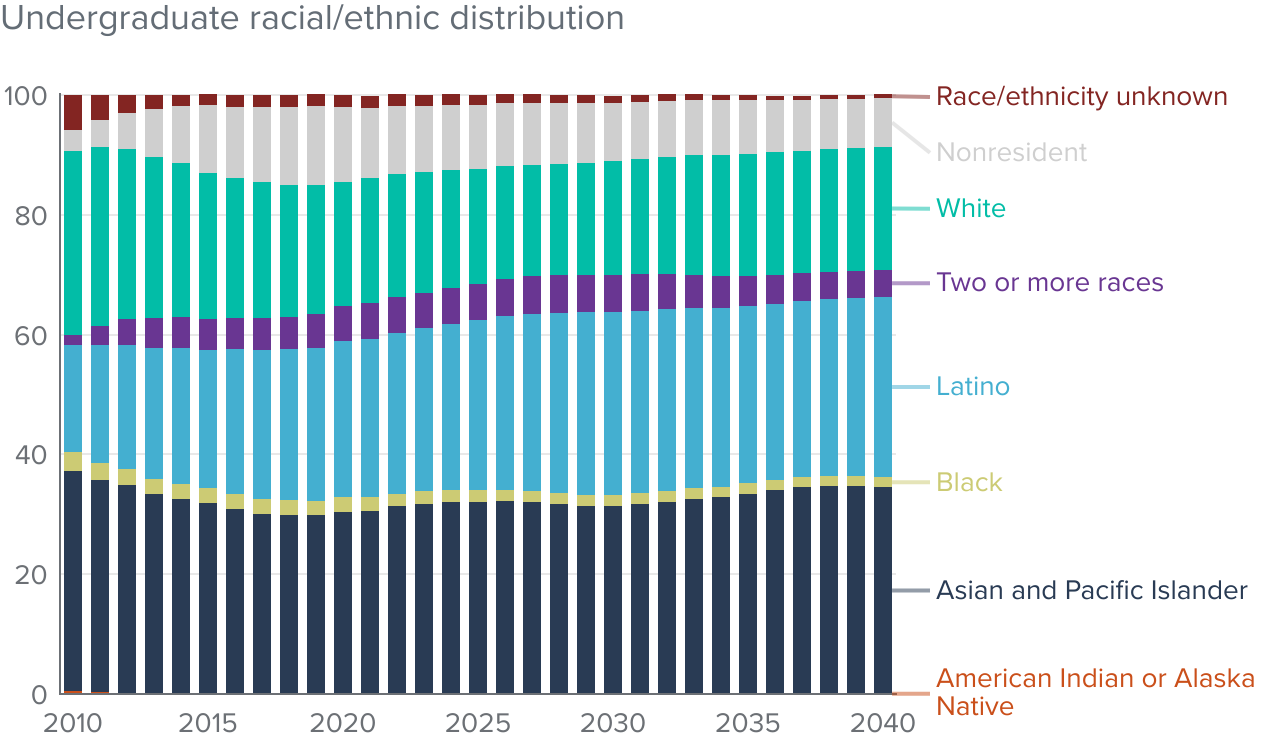
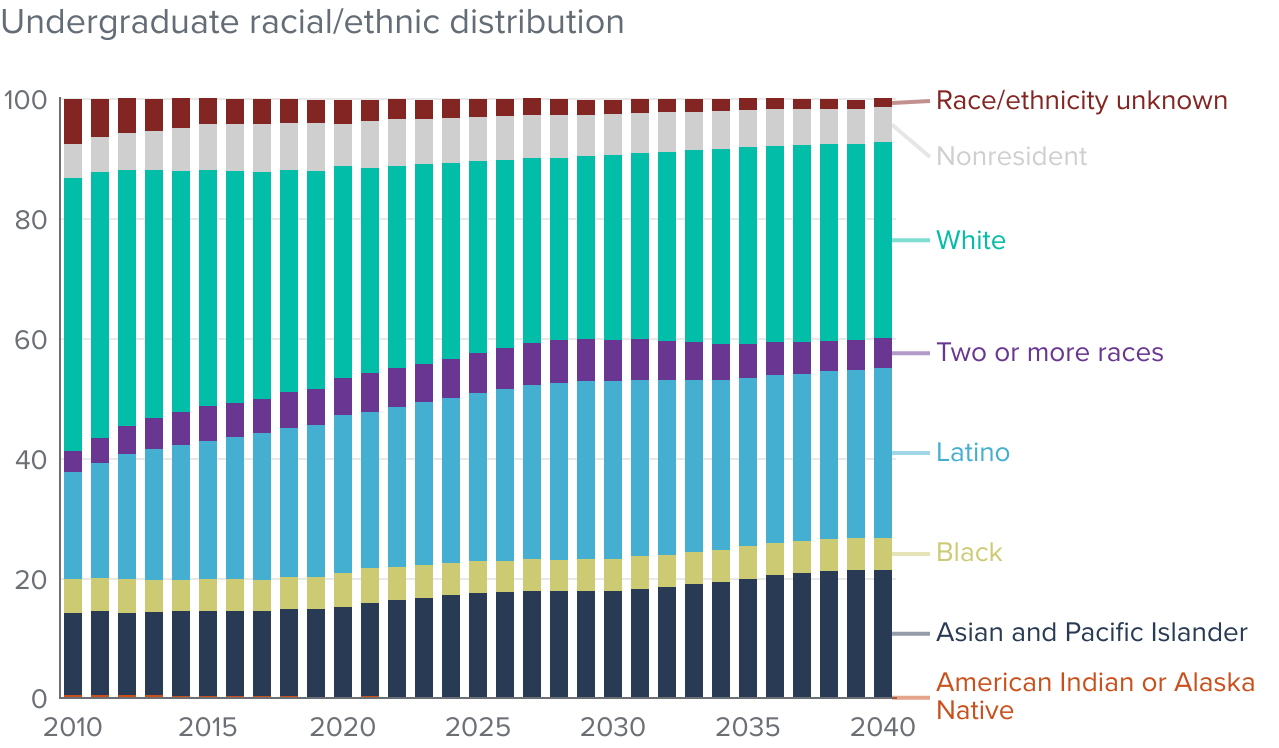
The state’s community colleges reflect the diversity of the state’s high school graduates and young adult population. Latinos are the largest group and will remain so (Figure 10). Among the three public systems, the racial/ethnic makeup of community college students is projected to change the least over the next 18 years.
Community college enrollment will increase somewhat before declining
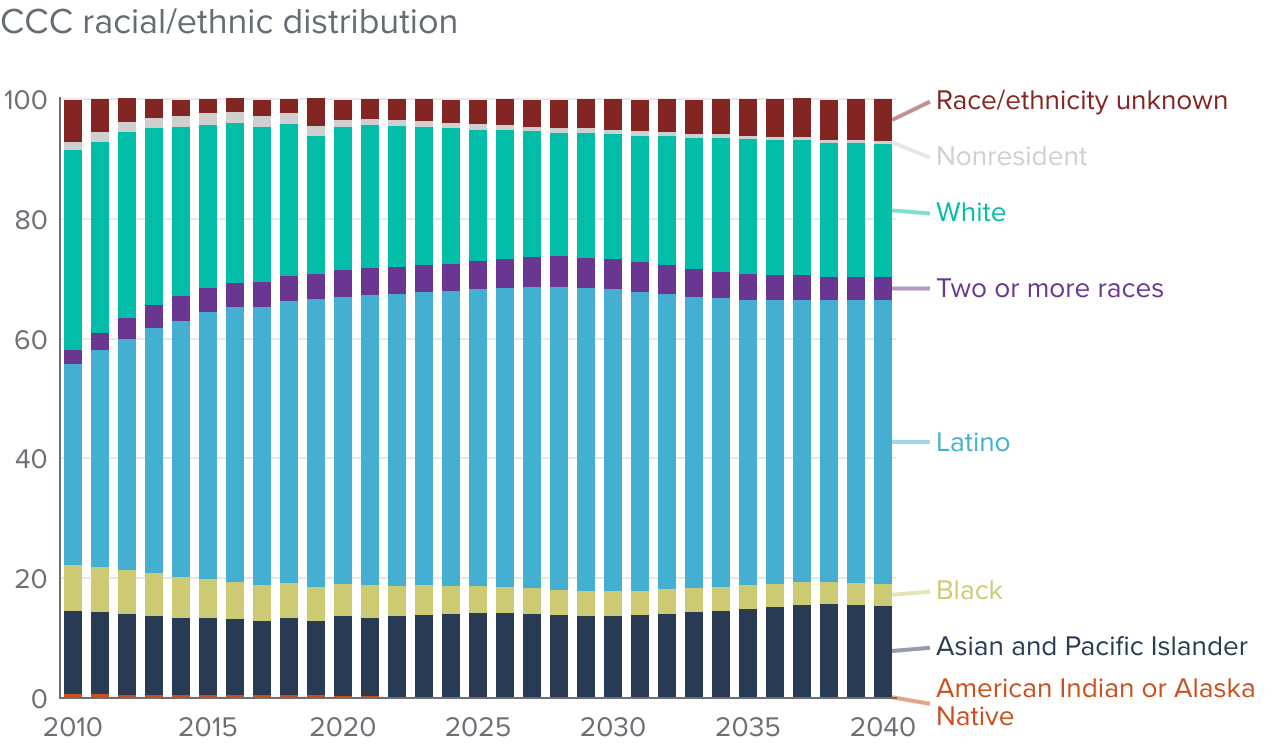
SOURCES: CCCCO to 2022 and PPIC projections 2023 to 2040.
NOTES: Fall enrollment. See Technical Appendix for details.
California’s Private Nonprofit Colleges Will See Modest Growth in the Next Decade
The state’s 99 private nonprofit colleges range dramatically in selectivity and size—from fewer than 1,000 students to more than 20,000 undergraduates (Figure 11). Most of the less-selective colleges have seen no enrollment growth or outright declines over the past ten years. According to our projections, private nonprofit colleges will see modest growth to 2035, after which enrollment will decline. By 2040, enrollment will be about the same as prior to the pandemic.
Many private nonprofit colleges enroll students from across the nation (and beyond), so it might not be surprising that this higher education segment does not fully reflect California’s diverse population. Even so, a majority of students at private nonprofit colleges are from California, and notable changes are projected to occur in terms of race/ethnic distributions. Specifically, white students are projected to remain the largest racial/ethnic group but will make up only a third of the undergraduate population (33%) in 2040, down from nearly half (47%) in 2010 (the earliest year of available data). The share of Latino students will increase to 28 percent of undergraduates, and the share of Asian students will rise to 21 percent. The share of white and Black students will decrease very slightly.
Private nonprofit enrollment will increase slightly

SOURCES: IPEDS to 2021 and PPIC projections 2022 to 2040.
NOTES: Restricted to Title IV degree-granting colleges. Excludes University of the People. See Technical Appendix for details.
California’s Public Systems Plan to Increase Enrollment—but Face Capacity and Funding Constraints
Meeting the state’s goal of reaching 70 percent postsecondary attainment among California adults by 2030 will require systematic planned increases in both demand and supply. In 2022, the Newsom administration forged multi-year compacts with UC and CSU through 2026–27 to increase the number of California resident undergraduates and graduates, including an agreement to provide funding for consistent enrollment gains. UC and CSU have developed their own plans for longer-term growth, which provide insights into how the state’s public institutions view the future of demand and how they envision meeting it. The CCC agreed to a roadmap with the state that did not contain specific funding commitments for enrollment increases, but the system has received additional funding tied to enrollment growth and continues to play a crucial role in supporting growth at UC and CSU through transfers. In this section, we highlight where the systems stand with their enrollment targets and discuss their longer-term plans for growth.
It should be noted that the projections presented earlier in the report are of headcount enrollments, which are based on estimates of the total number of individual students. Our projections are in line with the approach taken by the Department of Finance and reflect the potential number of students who could earn a degree. In this section, however, we present full-time equivalent (FTE) measures, which consider student’s credit-taking behavior. This metric is used by the state legislature for budgeting purposes and by each system to estimate capacity, as it better reflects the operating and capital costs required to serve students.
The Statewide Compacts Are in Flux
Generally speaking, the state sets enrollment expectations for UC and CSU in its annual budget, providing a General Fund augmentation based on the number of additional students each system is to enroll. The 2022 budget, enacted in a year of surplus, provided funding for increased enrollment at both systems, while the multi-year compacts laid out plans to increase base resources by 5 percent annually to support 1 percent enrollment gains each year through 2026–27.
With the state projected to face modest operating deficits over the next few years, the status of future funding is uncertain (LAO 2024a). The governor’s 2024–25 revised budget plan proposes to delay base increases for UC and CSU until next year and cut funding for other programs. Amid uncertainty about UC and CSU recovering from pandemic-induced enrollment declines and hitting their agreed-upon enrollment targets, recent budgets have provided adjusted yearly enrollment goals for each system, with the focus on reaching a cumulative target by 2026–27 (Table 1).
Plans to meet FTE enrollment goals in UC and CSU compacts

SOURCES: UC 2023 Compact Report and CSU 2023 Compact Report. Excludes out-of-state students.
NOTES: Represents FTE student enrollment. PPIC projections are headcount (not FTE enrollment) and include out-of-state students.
The UC 2023 Compact Report projects overall enrollment growth of over 16,000 FTE resident students, with more than a 3 percent increase in 2023–24 and more than 1 percent growth in each of the following years (UC 2023). The CSU 2023 Compact Report sets a more ambitious goal, to make up for a decline in FTE enrollment in 2022–23 (CSU 2023). CSU hopes to expand access at its most in-demand campuses by shifting new enrollment resources from campuses experiencing sustained enrollment declines. Adaptation and effective support will be crucial to widening access in the short term and meeting increased demand among A–G students in the long term.
Since 2021–22, the state budget has included about $30 million for 0.5 percent systemwide enrollment growth at CCC (equivalent to about 5,500 additional FTE students), per Proposition 98. Additionally, each budget included one-time funds to support community college efforts to increase retention rates and enrollment. Community college FTE enrollment seems to have increased in 2022–23 for the first time since the pandemic, but it remains far below pre-pandemic levels. The LAO estimated that at the time of the proposed 2024–25 budget, about a third of student outreach funding from the 2022–23 budget one-time allocation remained available (LAO 2024b). Colleges also have until 2026–27 to spend COVID-19 block grant funds, which can be used to increase enrollment and retention.
The State’s Public Institutions Have Longer-Term Enrollment and Capacity Plans—and Constraints
In addition to developing short-term plans to meet enrollment targets set by their compacts with the governor, UC, CSU, and CCC have also developed longer-term plans that project future enrollment and evaluate capacity needs.
UC’s long-term plans and challenges
The UC 2030 Capacity Plan outlines two enrollment scenarios from 2020–21 to 2029–30: a plan to add more than 23,000 state-supported undergraduate FTE students, in line with the original multi-year compact; and an aspirational plan to grow by over 33,000 state-supported undergraduate FTE students, which would require additional funding (UC Council of Chancellors Capacity Working Group 2022a). In its Building 2030 Capacity report, UC outlines enrollment goals and capacity needs for each campus (UC Council of Chancellors Capacity Working Group 2022b). Each UC campus also has its own Long Range Development Plan (LRDP); each LRDP includes population projections and estimates of growth potential over a specific planning horizon to inform comprehensive land use plans. Implementing LRDPs can be challenging. Part of the LRDP approval process includes preparing an Environmental Impact Report (EIR) in compliance with the California Environmental Quality Act (CEQA).
In addition, lawsuits and neighborhood opposition can delay expansion and construction, incur mitigation costs, and result in less-efficient growth. Relatedly, insufficient housing capacity continues to be a major challenge; several campuses have stressed the need to align enrollment growth with additional bed spaces. At UC Berkeley, for example, the campus LRDP projects growth of 8,100 students through 2036, but capacity constraints, stringent local sustainability goals, and neighborhood opposition may limit increases in enrollment.
Future enrollment growth may have to be accommodated outside of the system’s largest and most in-demand campuses. Promisingly, UC Merced and UC Riverside account for 30 percent and 35 percent of the UC system’s projected growth, respectively; this signals an emphasis on increasing enrollment among campuses in the San Joaquin Valley and Inland Empire, regions that have been historically underrepresented in the UC system. While these campuses face fewer challenges in expanding capacity, enrollment among admitted students at both campuses is relatively low compared to the rest of the system.
CSU enrollment demand and capacity constraints
The 2019 budget tasked the CSU Office of the Chancellor, in consultation with the California Department of Finance, to assess future growth, including statewide demand and physical capacity. In 2020, an independent consulting team conducted this analysis, producing a study titled The California State University: Enrollment Demand, Capacity Assessment, and Cost Analysis for Campus Sites, which presents a projection of undergraduate enrollment demand among first-time freshmen and transfer students through 2035 (HOK et al. 2020a, HOK et al. 2020b).
Importantly, the study relies on data collected and analyzed from November 2019 through March 2020. As a result, it does not factor in the large declines in enrollment and persistence brought on by the pandemic, which led to significant declines in transfers from community colleges. The report also leaves out other recent trends that are likely to affect future enrollment, such as changes in A–G completion rates after 2016, regional initiatives aimed at improving K–12 outcomes, adjustments to CSU admission requirements (e.g., the abolition of standardized testing requirements), the expansion of online learning, and efforts to widen transfer pathways and reduce barriers to transfer, and migration patterns to and from California.
Despite these limitations, we can glean useful insights from CSU’s projections of future demand in the context of expected growth in eligibility and regional demographic trends. The report projects a moderate increase in CSU enrollment through 2035, with a systemwide increase of approximately 43,800 FTE students, more than a quarter coming from the Central Valley. The report also finds that at the time of publication, systemwide CSU enrollment already exceeded its legislatively defined physical capacity, highlighting an immediate need to increase capacity. The authors estimated that the system would need to increase its capacity by more than 35 percent to meet 2035 projected enrollment demand (Table 2). Promisingly, aggregate plans to increase capacity across campuses were sufficient to meet this demand, assuming campuses could effectively and efficiently update and construct all planned facilities.
Projected 2035 CSU enrollment and current/planned capacity

NOTE: Tables 3.3 and 3.7 from report.
CCC’s uncertain future
As part of its projection of future transfers from the community colleges to CSU, the Enrollment Demand, Capacity Assessment, and Cost Analysis for Campus Sites study provides a pre-pandemic perspective on the future of community college enrollment (HOK et al. 2020a, HOK et al. 2020b). The study projects that community college enrollment among students taking 12 or more units per semester—a key indicator of the likelihood of transfer—would drop slightly from 2017 to 2035, with growth in the Central Valley and Inland Empire and declines in the Bay Area and Los Angeles. Alternatively, in its five-year capital outlay plan released in February 2024, the California Community College Chancellor’s Office projected 1.7 percent enrollment growth, an increase of over 24,000 students, from 2024–25 to 2028–29 (CCCCO 2024). While these differing projections reflect uncertainty about community college enrollment, increases over the past year suggest that growth may be possible. What does seem certain is CCC’s need for additional funding for capital facilities to accommodate any enrollment growth.
UC, CSU, and CCC Face Capital Facilities Funding Challenges
Historically, UC and CSU received capital facilities funding via voter-approved General Obligation (GO) bonds or lease-revenue bonds. However, no GO bonds have been approved since 2006. Funding streams have shifted since the systems were granted expanded debt-financing authority; funding now comprises a complex blend of debt instruments and revenue sources, including state bonds and loans, investment income, private investment, student fees, and philanthropy. It must be noted that CSU campuses have significantly less access to these sources than UC.
Local CCC districts—which have long made most of their own capital finance decisions and have the authority to tax and borrow—have been able to cover their capital needs. Still, all three systems have consistently stressed the need for capital facilities funding to support future enrollment growth. This need has not been sufficiently addressed in recent budget and compact targets, and state funding will likely be more difficult to secure given an uncertain budget future (UC 2023b, CSU 2023b, CCCCO 2024).
There is no state plan to address identified capital renewal needs, and the systems are facing growing maintenance backlogs (LAO 2023). Furthermore, the systems have all identified unmet funding needs for the construction of new facilities to accommodate growing student populations. SB 28, a bill that would have placed a $15.5 billion GO bond to fund K–16 facility construction on the March 2024 ballot was ultimately shelved. Future support for expanding student housing, in particular, remains uncertain. While the governor’s proposed budget for 2024–25 includes funding for the Higher Education Student Housing Grant (HESHG) program, which supports additional housing projects and helps maintain affordability among existing units, it also suspends significant investment in the California Student Housing Revolving Loan Fund Program, which provides zero-interest loans for below-market-rate student housing projects.
In short, the state’s higher education systems are likely to continue to face significant shortfalls in much-needed capital facilities funding. Long-term development plans from the UC, CSU, and CCC suggest enrollment growth is a priority, but accommodating this growth requires sufficient capacity, which in turn requires funding.
UC and CSU Have Developed Growth Strategies in the Context of Capacity Constraints
As we have seen, UC and CSU have struggled to meet the short-term goals laid out in their multi-year compacts, and they may face longer-term headwinds due to changes in the state’s demographics. And even if demand rises due to increases in A–G completion, the systems may face persistent supply and capacity constraints. Promisingly, UC and CSU have strategized several ways and implemented various initiatives to promote enrollment growth, addressing demand-side challenges by expanding opportunities for students to access their institutions, and addressing supply-side challenges by using current capacity more efficiently.
Both UC and CSU have prioritized expanding intersegmental collaboration. In its 2022 Budget Compact Report, CSU cited multiple efforts to boost enrollment, including a new partnership with the Los Angeles Unified School District, as well as planned collaboration with CCCs to expand dual enrollment opportunities (CSU 2022). UC’s 2030 Capacity Plan explicitly highlights the system’s goal of increasing enrollment at campuses in the San Joaquin Valley and Inland Empire through various intersegmental and outreach efforts, including collaboration with the community college and K–16 systems to streamline freshmen and transfer pathways.
Both systems have explored ways to increase transfers from community colleges, piloting dual admissions programs that guarantee admission for community college students who were not initially admitted as freshmen applicants, and expanding pathways through their respective Associate Degree for Transfer (ADT) program, Transfer Admission Guarantee (TAG), University of California Transfer Pathways (UCTP), and Pathways+.
Removing barriers to access is also a priority. Many programs and campuses at UC and CSU are impacted, meaning they receive more eligible applicants than can be accommodated. This, in turn, results in stricter admissions criteria that makes it more difficult for otherwise-eligible students to be admitted. Some CSU campuses have recently discontinued impaction, removing stricter admissions criteria for many of their programs in an attempt to address low yield rates among redirected admits and increase enrollment among qualified applicants.
At the same time, UC and CSU have embraced non-traditional growth strategies to increase enrollment in the context of current capacity constraints. Reducing the time it takes students to earn degrees not only helps campuses achieve their multi-year compact goals to increase graduation rates but also allows more new students to enroll. To reduce the time to degree, CSU and UC are providing more effective and tailored academic supports, offering expanded advising, improving their curricula, and scaling policies and practices that worked well during the pandemic.
The systems have also explored increasing online, summer, and off-campus offerings—including study abroad programs, off-campus internships, and partnerships with other institutions. Together, these efforts allow campuses to take in more students without having to expand their physical capacity.
Implications for the Future
The population of young adults most likely to attend college is expected to grow very slowly—or not at all—over the next couple of decades. But our projections show that if college-going rates—as well as persistence and graduation rates—continue to rise, college enrollment will increase slightly at least until 2035. Moreover, strong increases in college-going and completion among Latino students could help reduce educational attainment gaps among racial/ethnic groups.
A critical question is what this means for college completion. As we have seen, California has experienced sharp gains in the share of working-age adults with at least a bachelor’s degree, and it seems likely that continued increases in college participation will help California reach its baccalaureate completion goal of 40 percent by 2030. Compared to levels in many other states, however, this is a modest goal. It might be better to focus on increasing college completion among young adults to a higher level.
One approach would be to focus on the pathway from grade 9 to high school completion and then onto college completion. Currently, only about 35 percent of California ninth-graders will earn a bachelor’s degree by the time they are in their mid- to late 20s. Setting a goal of 45 percent would be both more ambitious and complementary to the current goal. By setting such a goal, California policymakers and higher education officials could concentrate their efforts at the precise ages where there is the most leverage: when high school students and young adults are making critical decisions about their educational pathways.
Our enrollment projections would translate to approximately 40 percent of young adults in California earning a bachelor’s degree by 2030 and almost 45 percent by 2040. We assume that there will be sufficient state support for students and the state’s colleges, and likely a relaxing of the outdated Master Plan guidelines for UC and CSU.
The capacity and enrollment plans of the state’s public universities are consistent with continued increases in college completion. Funding for increased capacity is often a challenge, but California’s long history of public investment in higher education is an impressive one. Bonds to pay for infrastructure, whether it is online capacity or brick and mortar classrooms, will need to be issued at some point. State support for annual operating expenses varies tremendously with state revenues, and multi-year compacts (or agreements) between the state and UC and CSU do not always weather these ups and downs. A long-term, flexible approach, involving a combination of tuition increases combined with increased financial aid, could help make higher education finance more predictable and sustainable.
Finally, increases in the number of high school graduates completing A–G coursework are critical to our projections. The statewide track record over the past couple of decades is impressive, but the pandemic has led to some disturbing trends, especially with respect to absenteeism. It is beyond the scope of this report to consider all the ways in which high schools can improve college readiness. But it is worth noting that there is wide variation in A–G completion across the state’s K–12 and high school districts, even among those with similar socioeconomic and demographic profiles. Clearly, local policies and practices—such as making A–G the default curriculum and creating a college-going culture—can and do make a difference.
It is important to underline that our projections of enrollment growth assume that the state’s university systems will be able to grow to accommodate student demand. This might require state investments in several areas, including capital and operating expenditures and financial aid for low- and middle-income students. Our underlying assumption is that if the state can increase the number of Californians who enroll in and graduate from college, California will continue to be a place of opportunity.
Topics
Access Completion Equity Finance Higher EducationLearn More